Category Archives: Basic
WPF TimeLine Custom Control
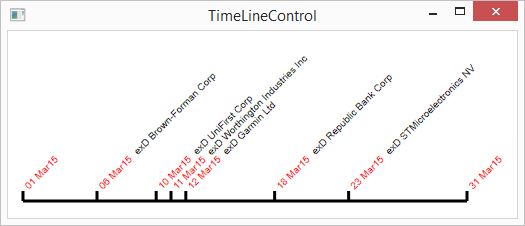
This is a custom WPF control and not a UserForm or a standard control with some extra properties in XAML. It is a proper class, which you would usually place in a library.
All Controls inherit from the FrameworkElement class. Some inherit from the Control Class, which is derived from the FrameworkElement class. In this case here I am deriving our custom control from the Canvas class, which in turn is derived from the Panel class and inherently FrameworkElement class. Once again I am not re-inventing the wheel and use existing functionality. Therefore the code remains pretty short. I am basically overriding the OnRender() event of the Canvas class.
This effects the design-time and run-time, which means you can see immediate results while you add the control in the XAML/Blend editor and of course when your C# application is running.
Just in case you are interested in further reading for design-time enhancements: WpfTutorial
The code in the MainWindow is not required. This is just a demonstration on how to change the display at run-time. A timer is used to make the change obvious. The code execution would be too fast otherwise. You wouldn’t see the first TimeLine graph, just the second. The method SetTimeSeries() triggers the change by invalidating the Canvas control (method InvalidateVisual()).
You can see a similar initialization in the TimeLineControl constructor. This data can be seen at design-time. You could also code that part in the XAML code, but this is not the purpose here. The control should not need any additional XAML in its ‘distributable’ version. Implement the TimeLineControl as it is. That is the beauty of overriding OnRender() rather than using WPF templates.
Design-time data display:
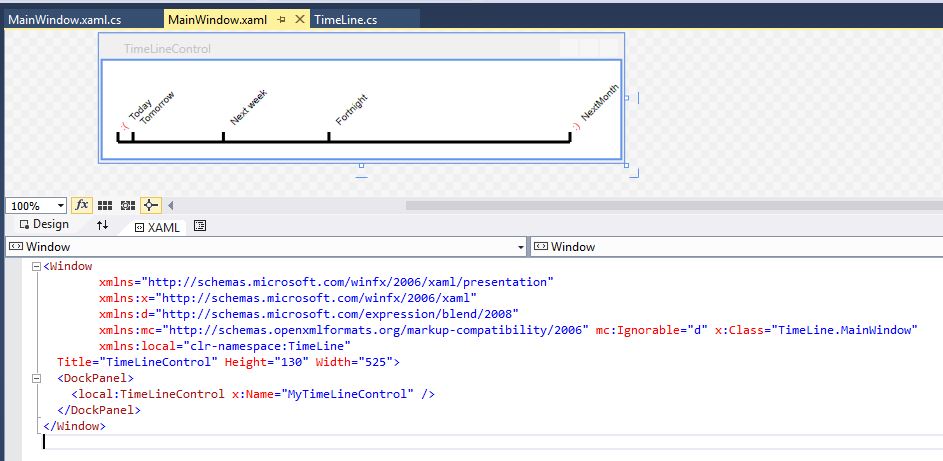
The inner control paddings and other settings were hard-coded. You can change these. Hard-coding made the example easier to understand – no redundant code to confuse you. Feel free to replace this part with flexible user settings or calculated values.
<Window
        xmlns="http://schemas.microsoft.com/winfx/2006/xaml/presentation"
        xmlns:x="http://schemas.microsoft.com/winfx/2006/xaml"
        xmlns:d="http://schemas.microsoft.com/expression/blend/2008"
        xmlns:mc="http://schemas.openxmlformats.org/markup-compatibility/2006" mc:Ignorable="d" x:Class="TimeLine.MainWindow"
        xmlns:local="clr-namespace:TimeLine"
  Title="TimeLineControl" Height="130" Width="525">
  <DockPanel>
    <local:TimeLineControl x:Name="MyTimeLineControl" />
  </DockPanel>
</Window>
using System;
using System.Collections.Generic;
using System.Timers;
using System.Windows;
using System.Windows.Documents;

namespace TimeLine {

  public partial class MainWindow : Window {
    public MainWindow() {
      InitializeComponent();

      Timer lTimer = new Timer(3000.0);
      lTimer.Elapsed += Timer_Elapsed;
      lTimer.Start();
    } // constructor

    void Timer_Elapsed(object xSender, ElapsedEventArgs e) {
      Timer lTimer = xSender as Timer;
      if (lTimer == null) return;
      lTimer.Stop();

      // demo: how to change the TimeLine
      List<TimeEvent> lList = new List<TimeEvent>();
      AddEvent(lList, new DateTime(2015, 03, 01), "");
      AddEvent(lList, new DateTime(2015, 03, 06), "exD Brown-Forman Corp");
      AddEvent(lList, new DateTime(2015, 03, 10), "exD UniFirst Corp");
      AddEvent(lList, new DateTime(2015, 03, 11), "exD Worthington Industries Inc");
      AddEvent(lList, new DateTime(2015, 03, 12), "exD Garmin Ltd");
      AddEvent(lList, new DateTime(2015, 03, 18), "exD Republic Bank Corp");
      AddEvent(lList, new DateTime(2015, 03, 23), "exD STMicroelectronics NV");
      AddEvent(lList, new DateTime(2015, 03, 31), "");
      MyTimeLineControl.SetTimeSeries(lList);
    } // constructor

    private void AddEvent(List<TimeEvent> xList, DateTime xDate, string xText) {
      TimeEvent lEvent = new TimeEvent();
      lEvent.Date = xDate;
      lEvent.TextRed = xDate.ToString("dd MMMyy");
      lEvent.TextBlack = xText;
      xList.Add(lEvent);
    } //

  } // class
} // namespace
using System;
using System.Collections.Generic;
using System.Globalization;
using System.Linq;
using System.Windows;
using System.Windows.Controls;
using System.Windows.Media;
using System.Windows.Shapes;

namespace TimeLine {
  public class TimeLineControl : Canvas {

    private IEnumerable<TimeEvent> _TimeSeries;

    public TimeLineControl() {
      Background = Brushes.White;
      List<TimeEvent> lList = new List<TimeEvent>();
      lList.Add(new TimeEvent { Date = DateTime.Today, TextRed = ":(", TextBlack = "Today" });
      lList.Add(new TimeEvent { Date = DateTime.Today.AddDays(1), TextRed = "", TextBlack = "Tomorrow" });
      lList.Add(new TimeEvent { Date = DateTime.Today.AddDays(7), TextRed = "", TextBlack = "Next week" });
      lList.Add(new TimeEvent { Date = DateTime.Today.AddDays(14), TextRed = "", TextBlack = "Fortnight" });
      lList.Add(new TimeEvent { Date = DateTime.Today.AddMonths(1), TextRed = ":)", TextBlack = "NextMonth" });
      _TimeSeries = lList;
    } // constructor

    public void SetTimeSeries(IEnumerable<TimeEvent> xList) {
      if (!Dispatcher.CheckAccess()) {
        Dispatcher.Invoke(() => SetTimeSeries(xList));
        return;
      }
      _TimeSeries = xList;
      InvalidateVisual();
    } //

    // some hardcoding to keep the example code simple
    const double cPaddingLeft = 15.0;
    const double cPaddingRight = 50.0;
    const double cPaddingBottom = 17.0;
    const double cMarkerLength = 10.0;
    const double cTextOffset = 5.0;   // distance to rotation point
    const double cTextSpace = 7.0;    // distance between the red and the black text
    const double cAngle = 45.0;       // rotation angle  (0.0 <= cAngle <= 180.0)

    protected override void OnRender(DrawingContext xDrawingContext) {
      base.OnRender(xDrawingContext);

      double lLeft = cPaddingLeft;
      double lRight = ActualWidth - cPaddingRight;
      double lBottom = ActualHeight - cPaddingBottom;
      double lWidth = ActualWidth - cPaddingLeft - cPaddingRight;

      Point p1 = new Point(lLeft, lBottom);
      Point p2 = new Point(lRight, lBottom);

      // draw the X-Axis
      Pen lPen = new Pen(Brushes.Black, 3.0);
      lPen.DashStyle = DashStyles.Solid;
      xDrawingContext.DrawLine(lPen, p1, p2);

      // determine range
      DateTime lMin = _TimeSeries.Min(x => x.Date);
      DateTime lMax = _TimeSeries.Max(x => x.Date);
      double lDateRange = lMax.Subtract(lMin).TotalDays;

      foreach (TimeEvent t in _TimeSeries) {
        double lRelativeX = t.Date.Subtract(lMin).TotalDays / lDateRange;
        double lAbsoluteX = lRelativeX * lWidth + lLeft;   // convert to canvas coordinates

        // draw the X-Axis marker
        p1 = new Point(lAbsoluteX, lBottom);
        p2 = new Point(lAbsoluteX, lBottom - cMarkerLength);
        xDrawingContext.DrawLine(lPen, p1, p2);

        // write the text with a 45 degrees angle
        Point lRotationCenter = p2;
        double lTextWidth = DrawText(xDrawingContext, t.TextRed, lRotationCenter, cTextOffset, Brushes.Red); // red text
        DrawText(xDrawingContext, t.TextBlack, lRotationCenter, lTextWidth + cTextOffset + cTextSpace, Brushes.Black); // black text
      }
    } //

    /// <returns>the width of the text</returns>
    private double DrawText(DrawingContext xDrawingContext, string xText, Point xPoint, double xOffset, SolidColorBrush xBrush) {
      Typeface lTypeface = new Typeface("Arial");
      CultureInfo lCultureInfo = CultureInfo.CurrentCulture;
      FormattedText lText = new FormattedText(xText, lCultureInfo, FlowDirection.LeftToRight, lTypeface, 10.0, xBrush);
      RotateTransform lRotateTransform = new RotateTransform(-cAngle, xPoint.X, xPoint.Y);
      xDrawingContext.PushTransform(lRotateTransform);
      xDrawingContext.DrawText(lText, new Point(xPoint.X + xOffset, xPoint.Y - lText.Height / 2.0));
      xDrawingContext.Pop();
      //return new Point(xPoint.X + lText.Height / 2.0 * Math.Sin(cAngle) + lText.Width * Math.Cos(cAngle) , xPoint.Y - lText.Width * Math.Sin(cAngle));
      return lText.Width;
    } //

    private void DrawLine(double x1, double x2, double y1, double y2) {
      Line lLine = new Line();
      lLine.Stroke = Brushes.LightSteelBlue;
      lLine.X1 = x1;
      lLine.X2 = x2;
      lLine.Y1 = y1;
      lLine.Y2 = y2;
      lLine.HorizontalAlignment = HorizontalAlignment.Left;
      lLine.VerticalAlignment = VerticalAlignment.Center;
      lLine.StrokeThickness = 2;
      Children.Add(lLine);
    } //

  } // class
} // namespace
using System;

namespace TimeLine {
  public class TimeEvent {
    public DateTime Date;
    public string TextRed;
    public string TextBlack;
  } // class
} // namespace
Clipboard to Text To Speech (TTS)

Since two years I am using Text To Speech (TTS). The quality has improved a lot. The spoken text can be understood and the pronunciations have reached good levels; not perfect though. Since Windows 7 there is no need to pay for a professional voice anymore. The Microsoft Windows system voices are sufficient.
First, I wanted to build my own add-on for the Firefox browser. But I quickly realised that there are too many constraints. I am using a nice tool on my Samsung Note 4 to listen to web site texts on a daily basis. That works out very well.
Nevertheless, this tool here is for home PCs.
ClipboardTTS monitors the windows clipboard and displays the current text in a WPF TextBox. In case the CheckBox “Auto” is checked the application starts speaking the text immediately. You can also generate WAV files. Adding this feature only took a few extra lines, otherwise it would not have been worth it. There are only a few use cases.
The Clipboard class offered in .Net does not provide events to monitor clipboard changes. We therefore have to use the old fashioned 32bit Windows functions. Therefore the codes section starts with imports from the windows “user32.dll”. With these you can subscribe to updates. The event WinProc notifies the application about changes. Most of these messages are disregarded in this application. We are only interested in two types of them. The first one is the Windows clipboard chain WM_CHANGECBCHAIN. You have to store the following window of the system clipboard chain, because we must forward messages to that one. This is a weird technology, but who knows what it is good for. For sure it simplifies suppressing messages without the need for any cancellation flag.
WM_DRAWCLIPBOARD is the other type we are interested in. This message tells you that the clipboard context has changed. Have a look at the C# code, you’ll quickly understand.
You could argue that the .Net Clipboard class is not needed, after all the user32.dll can do everything we need. Well, I think we should include as much .Net as possible. This is the right way to stick to the future.
Don’t forget to reference the System.Speech library in Visual Studio.

The application itself is pretty short. This is due to two facts. Windows is offering good SAPI voices and acceptable .Net support to use these voices.
http://msdn.microsoft.com/en-us/library/ee125077%28v=vs.85%29.aspx
I don’t see the point to implement an add-on for Firefox to follow the multi-platform approach. Do I have to re-invent the wheel? And check out the existing add-ons. You can hardly understand the spoken text. Some of these add-ons offer multi-language support. Yeah, but come on! You cannot understand a word. We are not in the 1990s anymore. Computers have learnt speaking very well. What is the language support good for if you cannot understand anything?
<Window x:Class="ClipboardTTS.MainWindow"
        xmlns="http://schemas.microsoft.com/winfx/2006/xaml/presentation"
        xmlns:x="http://schemas.microsoft.com/winfx/2006/xaml"
        Title="ClipboardTTS" Height="140" Width="263"
        Topmost="True"
        Loaded="Window_Loaded"
        Closed="Window_Closed">
  <DockPanel LastChildFill="True">
    <DockPanel DockPanel.Dock="Top" LastChildFill="False">
      <CheckBox Name="Checkbox_OnOff" DockPanel.Dock="Left" Content="Auto" Margin="5" ToolTip="Speak as soon as the clipboard text changes"/>
      <Button Content="Say it"  DockPanel.Dock="Right" Click="Button_SayIt_Click" Width="50" Margin="5" ToolTip="Start/Stop speaking"/>
      <Button Name="Button_Save" Content="Save"  DockPanel.Dock="Right" Click="Button_Save_Click" Width="50" Margin="5" ToolTip="Create WAV sound file"/>
    </DockPanel>
    <ComboBox Name="ComboBox_Voices" DockPanel.Dock="Top"  SelectionChanged="ComboBox_Voices_SelectionChanged" ToolTip="Voice"/>
    <Slider Name="Slider_Volumne" DockPanel.Dock="Top" Minimum="0" Maximum="100" Value="50" ValueChanged="Slider_Volumne_ValueChanged" ToolTip="Volume" />
    <TextBox Name="TextBox_Clipboard" TextChanged="TextBox_Clipboard_TextChanged" >
      hello world !
    </TextBox>
  </DockPanel>
</Window>
using System;
using System.Collections.ObjectModel;
using System.Runtime.InteropServices;
using System.Speech.Synthesis;
using System.Windows;
using System.Windows.Interop;
using System.Windows.Media;

namespace ClipboardTTS {
  public partial class MainWindow : Window {

    private const int WM_DRAWCLIPBOARD = 0x0308; // change notifications
    private const int WM_CHANGECBCHAIN = 0x030D; // another window is removed from the clipboard viewer chain
    private const int WM_CLIPBOARDUPDATE = 0x031D; // clipboard changed contents

    [DllImport("user32.dll", CharSet = CharSet.Auto, SetLastError = true)]
    private static extern IntPtr SetClipboardViewer(IntPtr xHWndNewViewer);

    [DllImport("user32.dll", CharSet = CharSet.Auto, SetLastError = true)]
    private static extern bool ChangeClipboardChain(IntPtr xHWndRemove, IntPtr xHWndNewNext);

    [DllImport("user32.dll", CharSet = CharSet.Auto, SetLastError = true)]
    private static extern IntPtr SendMessage(IntPtr xHWnd, int xMessage, IntPtr xWParam, IntPtr xLParam);

    private IntPtr _HWndNextViewer; // next window
    private HwndSource _HWndSource; // this window
    private string _Text = string.Empty;
    private SpeechSynthesizer _SpeechSynthesizer = new SpeechSynthesizer();

    public MainWindow() {
      InitializeComponent();
    } // constructor

    private void StartListeningToClipboard() {
      WindowInteropHelper lWindowInteropHelper = new WindowInteropHelper(this);
      _HWndSource = HwndSource.FromHwnd(lWindowInteropHelper.Handle);
      _HWndSource.AddHook(WinProc);
      _HWndNextViewer = SetClipboardViewer(_HWndSource.Handle);   // set this window as a viewer
    } //

    private void StopListeningToClipboard() {
      ChangeClipboardChain(_HWndSource.Handle, _HWndNextViewer); // remove from cliboard viewer chain
      _HWndNextViewer = IntPtr.Zero;
      _HWndSource.RemoveHook(WinProc);
    } //

    private void SayIt(string xText) {
      if (string.IsNullOrWhiteSpace(xText)) return;
      _SpeechSynthesizer.Volume = (int)Slider_Volumne.Value;
      _SpeechSynthesizer.SpeakAsync(xText);
    } //

    private IntPtr WinProc(IntPtr xHwnd, int xMessageType, IntPtr xWParam, IntPtr xLParam, ref bool xHandled) {
      switch (xMessageType) {
        case WM_CHANGECBCHAIN:
          if (xWParam == _HWndNextViewer) _HWndNextViewer = xLParam;
          else if (_HWndNextViewer != IntPtr.Zero) SendMessage(_HWndNextViewer, xMessageType, xWParam, xLParam);
          break;

        case WM_DRAWCLIPBOARD:
          SendMessage(_HWndNextViewer, xMessageType, xWParam, xLParam);

          processWinProcMessage();
          break;
      }

      return IntPtr.Zero;
    } //

    private void processWinProcMessage() {
      if (!Dispatcher.CheckAccess()) {
        Dispatcher.Invoke(processWinProcMessage);
        return;
      }

      if (!Clipboard.ContainsText()) return;
      string lPreviousText = _Text;
      _Text = Clipboard.GetText();
      if (_Text.Equals(lPreviousText)) return; // do not play the same text again
      InsertTextIntoTextBox(_Text);
      if (Checkbox_OnOff.IsChecked.Value) SayIt(_Text);
    } //

    private void InsertTextIntoTextBox(string xText) {
      if (!TextBox_Clipboard.Dispatcher.CheckAccess()) {
        TextBox_Clipboard.Dispatcher.Invoke(() => InsertTextIntoTextBox(xText));
        return;
      }
      TextBox_Clipboard.Text = xText;
    } //

    private void Button_SayIt_Click(object xSender, RoutedEventArgs e) {
      if (_SpeechSynthesizer.State == SynthesizerState.Speaking) {
        _SpeechSynthesizer.SpeakAsyncCancelAll();
        return;
      }
      SayIt(TextBox_Clipboard.Text);
    } //

    private void TextBox_Clipboard_TextChanged(object xSender, System.Windows.Controls.TextChangedEventArgs e) {
      _Text = TextBox_Clipboard.Text;
    } //

    private void Window_Loaded(object xSender, RoutedEventArgs e) {
      ReadOnlyCollection<InstalledVoice> lVoices = _SpeechSynthesizer.GetInstalledVoices();
      if (lVoices.Count < 1) return;

      foreach (InstalledVoice xVoice in lVoices) {
        ComboBox_Voices.Items.Add(xVoice.VoiceInfo.Name);
      }
      ComboBox_Voices.SelectedIndex = 0;

      StartListeningToClipboard();
    } //

    private void Window_Closed(object xSender, EventArgs e) {
      StopListeningToClipboard();
    } //

    private void ComboBox_Voices_SelectionChanged(object sender, System.Windows.Controls.SelectionChangedEventArgs e) {
      string xVoice = ComboBox_Voices.SelectedItem as string;
      if (string.IsNullOrWhiteSpace(xVoice)) return;
      _SpeechSynthesizer.SelectVoice(xVoice);
    } //

    private void Slider_Volumne_ValueChanged(object xSender, RoutedPropertyChangedEventArgs<double> e) {
      _SpeechSynthesizer.Volume = (int)Slider_Volumne.Value;
    } //

    private Brush _OldButtonBrush = SystemColors.ControlBrush;
    private void Button_Save_Click(object xSender, RoutedEventArgs e) {
      _OldButtonBrush = Button_Save.Background;
      Button_Save.Background = Brushes.Salmon;
      Microsoft.Win32.SaveFileDialog lDialog = new Microsoft.Win32.SaveFileDialog();
      string lPath = Environment.GetFolderPath(Environment.SpecialFolder.Desktop);
      lDialog.InitialDirectory = lPath;
      lDialog.FileOk += FileDialog_FileOk;
      lDialog.Filter = "All Files|*.*|WAV (*.wav)|*.wav";
      lDialog.FilterIndex = 2;
      lDialog.ShowDialog();
    } //

    void FileDialog_FileOk(object xSender, System.ComponentModel.CancelEventArgs e) {
      Microsoft.Win32.SaveFileDialog lDialog = xSender as Microsoft.Win32.SaveFileDialog;
      if (lDialog == null) return;

      if (!Dispatcher.CheckAccess()) {
        Dispatcher.Invoke(() => FileDialog_FileOk(xSender, e));
        return;
      }

      try {
        string lPathAndFile = lDialog.FileName;
        _SpeechSynthesizer.SetOutputToWaveFile(lPathAndFile);
        _SpeechSynthesizer.SpeakCompleted += SpeechSynthesizer_SpeakCompleted;
        SayIt(TextBox_Clipboard.Text);
        Button_Save.Background = _OldButtonBrush;
      }
      catch (Exception ex) { MessageBox.Show(ex.Message); }
    } //

    void SpeechSynthesizer_SpeakCompleted(object sender, SpeakCompletedEventArgs e) {
      _SpeechSynthesizer.SetOutputToDefaultAudioDevice();
      _SpeechSynthesizer.SpeakCompleted -= SpeechSynthesizer_SpeakCompleted;
    } //

  } // class
} // namespace
WPF Charts (Part 6)

Scrolling day
Sometimes charts are too big, axes look like ugly clusters and details vanish in the limitedness of limits. You can flip labels by 90 degrees, but this won’t always solve the problem.
There is a simple way for beginners to zoom a graph. Use the ScrollViewer control and set the size of the inner context to something larger than the control. This works fine. It is just looks slightly irritating. The axes are disappearing from the visible area as soon as you start scrolling. This is demonstrated in the left graph.
A more advanced approach can be found in the right graph. There are 4 ScrollBars. The inner ScrollBars are moving the visible graph area. The outer ScrollBars are determining the zoom level. This can be achieved by setting the minimum and maximum properties of the corresponding axis. Take care to never cross these values. The minimum must be less than the maximum. Therefore, when you for instance increase the X-axis position, you should first set the new maximum and then the new minimum. Don’t do it the other way around.
My first try to scroll charts involved value converters. You would bind the minimum and then automatically set the maximum. This approach does not work. You quickly get exceptions where the minimum is larger than the maximum. But events can deal with this easily.
<Window x:Class="Demo.MainWindow"
    xmlns="http://schemas.microsoft.com/winfx/2006/xaml/presentation"
    xmlns:x="http://schemas.microsoft.com/winfx/2006/xaml"
    xmlns:local="clr-namespace:Demo"
    xmlns:datavisualization="clr-namespace:System.Windows.Controls.DataVisualization;assembly=System.Windows.Controls.DataVisualization.Toolkit"
    xmlns:chart="clr-namespace:System.Windows.Controls.DataVisualization.Charting;assembly=System.Windows.Controls.DataVisualization.Toolkit"
    Title="Demo Window"
    Loaded ="Window_Loaded">

  <Grid>
    <Grid.ColumnDefinitions>
      <ColumnDefinition Width="1*"/>
      <ColumnDefinition Width="1*"/>
    </Grid.ColumnDefinitions>

    <ScrollViewer HorizontalScrollBarVisibility="Visible" VerticalScrollBarVisibility="Visible"
                Grid.Column="0">
      <chart:Chart Name="myChart1"
            Width="1000" Height="600">

        <chart:Chart.LegendStyle>
          <Style TargetType="datavisualization:Legend">
            <Setter Property="Width" Value="0" />
          </Style>
        </chart:Chart.LegendStyle>

        <chart:Chart.Axes>
          <chart:LinearAxis Name="YAxis1" Orientation="Y" ShowGridLines="False" />
          <chart:LinearAxis Name="XAxis1" Orientation="X" ShowGridLines="False"/>
        </chart:Chart.Axes>

        <chart:LineSeries Name="MyLineSeries1" ItemsSource="{Binding}"
                        IndependentValueBinding="{Binding X}"
                        DependentValueBinding="{Binding Y}">
          <chart:LineSeries.DataPointStyle>
            <Style TargetType="{x:Type chart:LineDataPoint}">
              <Setter Property="Background" Value="Black" />
              <Setter Property="Height" Value="0"/>
              <Setter Property="Width" Value="0"/>
            </Style>
          </chart:LineSeries.DataPointStyle>
        </chart:LineSeries>
      </chart:Chart>
    </ScrollViewer>

    <Grid Grid.Column="1">
      <DockPanel LastChildFill="True" >
        <ScrollBar Name="HBarZoom"
                   Height="20" DockPanel.Dock="Bottom" Orientation="Horizontal"
                   BorderBrush="Black"
                   Value="50" Minimum="1" Maximum="100"
                   Margin="0,0,40,0"
                   ValueChanged="HBar_ValueChanged"/>
        <ScrollBar Name="HBar"
                   Height="20" DockPanel.Dock="Bottom" Orientation="Horizontal"
                   BorderBrush="Black"
                   Value="250" Minimum="0" Maximum="100"
                   Margin="0,0,40,0"
                   ValueChanged="HBar_ValueChanged"/>
        <ScrollBar Name="VBarZoom"
                   Width="20" DockPanel.Dock="Right" Orientation="Vertical"
                   BorderBrush="Black"
                   Value="50" Minimum="1" Maximum="100"
                   ValueChanged="VBar_ValueChanged">
          <ScrollBar.LayoutTransform>
            <RotateTransform Angle="180"/>
          </ScrollBar.LayoutTransform>
        </ScrollBar>
        <ScrollBar Name="VBar"
                   Width="20" DockPanel.Dock="Right" Orientation="Vertical"
                   Value="1" Minimum="0" Maximum="1000000"
                   BorderBrush="Black"
                   ValueChanged="VBar_ValueChanged">
          <ScrollBar.LayoutTransform>
            <RotateTransform Angle="180"/>
          </ScrollBar.LayoutTransform>
        </ScrollBar>
        <chart:Chart Name="myChart2" DockPanel.Dock="Bottom">

          <chart:Chart.LegendStyle>
            <Style TargetType="datavisualization:Legend">
              <Setter Property="Width" Value="0" />
            </Style>
          </chart:Chart.LegendStyle>

          <chart:Chart.Axes>
            <chart:LinearAxis Name="YAxis2" Orientation="Y" ShowGridLines="False" />
            <chart:LinearAxis Name="XAxis2" Orientation="X" ShowGridLines="False" />
          </chart:Chart.Axes>

          <chart:LineSeries Name="MyLineSeries2" ItemsSource="{Binding}"
                        IndependentValueBinding="{Binding X}"
                        DependentValueBinding="{Binding Y}">
            <chart:LineSeries.DataPointStyle>
              <Style TargetType="{x:Type chart:LineDataPoint}">
                <Setter Property="Background" Value="Black" />
                <Setter Property="Height" Value="0"/>
                <Setter Property="Width" Value="0"/>
              </Style>
            </chart:LineSeries.DataPointStyle>
          </chart:LineSeries>
        </chart:Chart>

      </DockPanel>

    </Grid>
  </Grid>

</Window>
using System;
using System.Collections.Generic;
using System.Windows;
using System.Linq;

namespace Demo {

  public partial class MainWindow : Window {
    private double _YMin, _YMax;
    private int _XMin = 0, _XMax = 2000;

    public MainWindow() {
      InitializeComponent();
    } // constructor

    private void Window_Loaded(object xSender, RoutedEventArgs e) {
      // add arbitrary LineSeries points
      List<Point> lPoints = new List<Point>();
      Random lRandom = new Random();
      double y = 1.0;
      double lYMin = double.MaxValue;
      double lYMax = double.MinValue;

      for (int i = _XMin; i < _XMax; i++) {
        double lChange = lRandom.NextDouble() - 0.5;

        y += lChange / 100.0;
        if (y > lYMax) lYMax = y;
        if (y < lYMin) lYMin = y;
        Point lPoint = new Point((double)i, y);
        lPoints.Add(lPoint);
      }

      _YMax = lYMax;
      _YMin = lYMin;
      VBar.Maximum = lYMax;
      VBar.Minimum = lYMin;
      HBar.Minimum = _XMin;
      HBar.Maximum = _XMax;

      // we clone the list to avoid trouble (deep copy)
      List<Point> lPoints2 = (from p in lPoints select new Point(p.X, p.Y)).ToList();

      MyLineSeries1.ItemsSource = lPoints;
      MyLineSeries2.ItemsSource = lPoints2;
    } //

    private void HBar_ValueChanged(object xSender, RoutedPropertyChangedEventArgs<double> e) {
      if (XAxis2 == null) return;

      double? lMax = XAxis2.Maximum; if (lMax == null) lMax = XAxis2.ActualMaximum;
      //double? lMin = XAxis2.Minimum; if (lMin == null) lMin = XAxis2.ActualMinimum;
      double lZoom = (_XMax - _XMin) * HBarZoom.Value / 100.0 / 2.0;
      double lValue = HBar.Value; // We do not use e.NewValue, because this event is called from many sources.

      if (lValue > lMax) {
        XAxis2.Maximum = Math.Max(lValue + lZoom, _XMax);        // widen the range first!
        XAxis2.Minimum = Math.Min(XAxis2.Maximum.Value - lZoom, _XMin);        // now we can tighten the range
        return;
      }
      XAxis2.Minimum = Math.Max(lValue - lZoom, _XMin);          // widen
      XAxis2.Maximum = Math.Min(XAxis2.Minimum.Value + lZoom, _XMax);          // tighten

      e.Handled = true;
    } //

    private void VBar_ValueChanged(object xSender, RoutedPropertyChangedEventArgs<double> e) {
      if (XAxis2 == null) return;

      double? lMax = YAxis2.Maximum; if (lMax == null) lMax = YAxis2.ActualMaximum;
      //double? lMin = YAxis2.Minimum; if (lMin == null) lMin = YAxis2.ActualMinimum;
      double lZoom = (_YMax - _YMin) * VBarZoom.Value / 100.0 / 2.0;
      double lValue = VBar.Value; // We do not use e.NewValue, because this event is called from many sources.

      if (lValue > lMax) {
        YAxis2.Maximum = Math.Min(lValue + lZoom, _YMax);
        YAxis2.Minimum = Math.Max(YAxis2.Maximum.Value - lZoom, _YMin);
        return;
      }
      YAxis2.Minimum = Math.Max(lValue - lZoom, _YMin);
      YAxis2.Maximum = Math.Min(YAxis2.Minimum.Value + lZoom, _YMax);

      e.Handled = true;
    } //

  } // class
} // namespace
WPF Charts (Part 5)

Benchmarks
When people measure the round-trip of something, they often only show time differences. This chart shows the start time and its completion time, both relative to the theoretical/ideal start time. There are twenty groups with 40 measurements each. The top line of each group (red line) shows the first measurement. Further measurements are placed consecutively below.
We now get a precise idea. When was a task started, when did it end? This can be very important for some hard-core programmers.
What is implemented in this post?
- Labels are replaced by a simple IValueConverter text.
- The MicroTimer class, which was introduced in my post “Timer Finetuning, Each Microsecond Counts”, got new methods to convert between DateTime ticks and Stopwatch ticks by averaging 100 measurements and eliminating the imprecision of the DateTime class.
- The Dispatcher class is used actively. The Console window of the previous examples was thread-safe, but now we need to switch to the right thread – the dispatcher thread.
- All line series are added at runtime.
- A Datagrid displays simple log information. I prefer Datagrids, because they are easier to deal with than Listviews. There are many features that Listviews are not natively supporting.
- Hiding the chart legend.
- The first MicroTimer event is not used and hence discarded. This has to do with the runtime compilation, which slows down the first run and makes it unpredictable in terms of micro timing.
- X-Axis in milliseconds, Y-Axis in whatever you like (text).
We are coming to an end with my Chart posts. One more and then I will slowly delve into some Excel techniques.
<Window x:Class="Demo.MainWindow"
    xmlns="http://schemas.microsoft.com/winfx/2006/xaml/presentation"
    xmlns:x="http://schemas.microsoft.com/winfx/2006/xaml"
    xmlns:local="clr-namespace:Demo"
    xmlns:datavisualization="clr-namespace:System.Windows.Controls.DataVisualization;assembly=System.Windows.Controls.DataVisualization.Toolkit"
    xmlns:chart="clr-namespace:System.Windows.Controls.DataVisualization.Charting;assembly=System.Windows.Controls.DataVisualization.Toolkit"
    Title="Demo Window"
    Loaded ="Window_Loaded">

  <Window.Resources>
    <local:MyLabelConverter x:Key="MyLabelConverter" />
  </Window.Resources>

  <DockPanel LastChildFill="True">
    <DataGrid Name="InfoText"
              AutoGenerateColumns="True"
              CanUserAddRows="False" CanUserReorderColumns="True" CanUserResizeColumns="True" CanUserResizeRows="False"
              SelectionUnit="Cell" SelectionMode="Extended"
              Height="100" DockPanel.Dock="Top"/>
    <chart:Chart Name="myChart"
            DockPanel.Dock="Top"
            Width="Auto" Height="Auto"
            MinWidth="400" MinHeight="300">

      <chart:Chart.LegendStyle>
        <Style TargetType="datavisualization:Legend">
          <Setter Property="Width" Value="0" />
        </Style>
      </chart:Chart.LegendStyle>

      <chart:Chart.Axes>
        <chart:LinearAxis Name="SharedYAxis" Orientation="Y" ShowGridLines="False" >
          <chart:LinearAxis.AxisLabelStyle>
            <Style TargetType="chart:AxisLabel">
              <Setter Property="Template">
                <Setter.Value>
                  <ControlTemplate TargetType="chart:AxisLabel">
                    <TextBlock Text="{Binding Converter={StaticResource MyLabelConverter}}" />
                  </ControlTemplate>
                </Setter.Value>
              </Setter>
            </Style>
          </chart:LinearAxis.AxisLabelStyle>

        </chart:LinearAxis>
        <chart:LinearAxis Name="SharedXAxis" Orientation="X" ShowGridLines="True">

          <!--rotate the X-Axis labels -->
          <chart:LinearAxis.AxisLabelStyle>
            <Style TargetType="chart:NumericAxisLabel">
              <Setter Property="Template">
                <Setter.Value>
                  <ControlTemplate TargetType="chart:NumericAxisLabel">
                    <TextBlock Text="{TemplateBinding FormattedContent}">
                      <TextBlock.LayoutTransform>
                        <RotateTransform Angle="90" CenterX = "40" CenterY = "30"/>
                      </TextBlock.LayoutTransform>
                    </TextBlock>
                  </ControlTemplate>
                </Setter.Value>
              </Setter>
            </Style>
          </chart:LinearAxis.AxisLabelStyle>

        </chart:LinearAxis>
      </chart:Chart.Axes>
    </chart:Chart>

  </DockPanel>
</Window>
using System;

namespace Demo {

  public class CurvePoint {
    public double CurveId { get; set; }  // Y value
    public double Time { get; set; }     // X value

    public CurvePoint(double xCurveId, double xTime) {
      CurveId = xCurveId;
      Time = xTime;
    } // constructor
  } // class

} // namespace
using System;

namespace Demo {
  public class InfoText {
    public string TimeStamp { get; private set; }
    public string Text { get; private set; }

    public InfoText(string xText) {
      TimeStamp = DateTime.Now.ToString("HH:mm:ss_fff");
      Text = xText;
    } //

  } // classs
} // namespace
using System;
using System.Collections.ObjectModel;
using System.Windows;
using System.Windows.Input;

namespace Demo {

  public partial class MainWindow : Window {

    private Model _Model;
    private ViewModel _ViewModel;

    public MainWindow() {
      InitializeComponent();
    } // constructor

    private void Window_Loaded(object sender, RoutedEventArgs e) {
      _ViewModel = new ViewModel(this);
      DataContext = _ViewModel;
      _Model = new Model(_ViewModel);
    } //

  } // class
} // namespace
using System;
using System.Collections.Generic;
using System.Diagnostics;
using System.Threading;

namespace Demo {
  public class MicroTimer {

    private readonly Queue<long> _TickTimeTable;
    private readonly Thread _Thread;
    private readonly long _MaxDelayInTicks;  // do not run if the delay was too long
    private long _NextWakeUpTickTime;

    public delegate void dOnMicroTimer(int xSenderThreadId, long xWakeUpTimeInTicks, long xDelayInTicks);
    public event dOnMicroTimer OnMicroTimer;
    public event dOnMicroTimer OnMicroTimerSkipped;

    public delegate void dQuickNote(int xSenderThreadId);
    public event dQuickNote OnMicroTimerStart;
    public event dQuickNote OnMicroTimerStop;

    public MicroTimer(Queue<long> xTickTimeTable, long xMaxDelayInTicks) {
      _TickTimeTable = xTickTimeTable;
      _Thread = new Thread(new ThreadStart(Loop));
      _Thread.Priority = ThreadPriority.Highest;
      _Thread.Name = "TimerLoop";
      _Thread.IsBackground = true;
      _MaxDelayInTicks = xMaxDelayInTicks;
    } //

    public int Start() {
      if ((_Thread.ThreadState & System.Threading.ThreadState.Unstarted) == 0) return -1;
      _Thread.Start();
      return _Thread.ManagedThreadId;
    } //

    public void Stop() {
      _Thread.Interrupt();
    } //

    private void Loop() {
      dQuickNote lOnStart = OnMicroTimerStart;
      if (lOnStart != null) lOnStart(_Thread.ManagedThreadId);

      try {
        while (true) {
          if (_TickTimeTable.Count < 1) break;
          _NextWakeUpTickTime = _TickTimeTable.Dequeue();
          long lMilliseconds = _NextWakeUpTickTime - Stopwatch.GetTimestamp();
          if (lMilliseconds < 0L) continue;
          lMilliseconds = (lMilliseconds * 1000) / Stopwatch.Frequency;
          lMilliseconds -= 50;  // we want to wake up earlier and spend the last time using SpinWait
          Thread.Sleep((int)lMilliseconds);

          while (Stopwatch.GetTimestamp() < _NextWakeUpTickTime) {
            Thread.SpinWait(10);
          }
          long lWakeUpTimeInTicks = Stopwatch.GetTimestamp();
          long lDelay = lWakeUpTimeInTicks - _NextWakeUpTickTime;
          if (lDelay < _MaxDelayInTicks) {
            dOnMicroTimer lHandler = OnMicroTimer;
            if (lHandler == null) continue;
            lHandler(_Thread.ManagedThreadId, lWakeUpTimeInTicks, lDelay);
          }
          else {
            dOnMicroTimer lHandler = OnMicroTimerSkipped;
            if (lHandler == null) continue;
            lHandler(_Thread.ManagedThreadId, lWakeUpTimeInTicks, lDelay);
          }
        }
      }
      catch (ThreadInterruptedException) { }
      catch (Exception) { Console.WriteLine("Exiting timer thread."); }

      dQuickNote lOnStop = OnMicroTimerStop;
      if (lOnStop != null) lOnStop(_Thread.ManagedThreadId);
    } //

    public static double getDateTimeToStopwatchTickRatio() {
      const double cMeasurements = 100.0;
      double lTotalMilliseconds = 0.0;
      double lTotalTicks = 0.0;

      // averaging to interpolate the inprecision of the DateTime class
      // note: DateTime ticks are not Stopwatch ticks!
      for (double i = 0; i < cMeasurements + 0.001; i++) {
        DateTime lDateTime = DateTime.Now;
        long lTicks = Stopwatch.GetTimestamp();
        TimeSpan lTimeSpan = lDateTime.TimeOfDay;
        lTotalMilliseconds += lTimeSpan.TotalMilliseconds / cMeasurements;
        lTotalTicks += lTicks / cMeasurements;
        Thread.Sleep(5);
      }

      return lTotalTicks / lTotalMilliseconds;
    } //

    public static long convertTimeToTicks(DateTime xDateTime, double xRatio) {
      return (long)(xDateTime.TimeOfDay.TotalMilliseconds * xRatio);
    } //

    public static DateTime convertTicksToTime(long xTicks, double xRatio) {
      DateTime lToday = DateTime.Today;
      lToday = lToday.AddMilliseconds(xTicks / xRatio);
      return lToday;
    } //

  } // class
} // namespace
using System;
using System.Collections.Generic;
using System.Diagnostics;
using System.Threading;
using System.Threading.Tasks;

namespace Demo {
  public class Model {
    private const int cNumTasks = 20;
    private const int cNumTriggers = 41; // we discard the first measurement
    private ViewModel _ViewModel;
    private double _DateTimeToStopwatchTickRatio;

    public Model(ViewModel xViewModel) {
      _DateTimeToStopwatchTickRatio = MicroTimer.getDateTimeToStopwatchTickRatio();
      _ViewModel = xViewModel;
      StartTimer(cNumTriggers);
    } // constructor

    private void StartTimer(int xNumTriggers) {
      DateTime lDateTime = DateTime.Now.AddSeconds(3.0); // an arbitrary ideal start time

      long lStartTimeInStopwatchTicks = MicroTimer.convertTimeToTicks(lDateTime, _DateTimeToStopwatchTickRatio);
      double lStartInXSeconds = (lStartTimeInStopwatchTicks - Stopwatch.GetTimestamp()) / Stopwatch.Frequency;
      //_ViewModel.InfoBoxText =  lStartInXSeconds + " secs" ;

      long[] lSchedule = new long[xNumTriggers];
      long lTwoSecsInTicks = 2 * Stopwatch.Frequency;
      for (int i = 0; i < xNumTriggers; i++) {
        lSchedule[i] = lStartTimeInStopwatchTicks;
        lStartTimeInStopwatchTicks += lTwoSecsInTicks;
      }

      long lMaxDelay = (5L * Stopwatch.Frequency) / 1000L; // 5 ms
      MicroTimer lMicroTimer = new MicroTimer(new Queue<long>(lSchedule), lMaxDelay);
      lMicroTimer.OnMicroTimer += OnMicroTimer;
      lMicroTimer.OnMicroTimerStop += OnMicroTimerStop;
      lMicroTimer.OnMicroTimerSkipped += OnMicroTimerSkipped;
      lMicroTimer.Start();
    } //

    private void OnMicroTimerSkipped(int xSenderThreadId, long xWakeUpTimeInTicks, long xDelayInTicks) {
      _ViewModel.AddInfoText("OnMicroTimerSkipped event raised");
    } //

    private void OnMicroTimerStop(int xSenderThreadId) {
      _ViewModel.AddInfoText("OnMicroTimerStop event raised");
    } //

    private double _NumberOfMicroTimerCalls;
    private bool _Once = true;
    private void OnMicroTimer(int xSenderThreadId, long xWakeUpTimeInTicks, long xDelayInTicks) {
      _ViewModel.AddInfoText("OnMicroTimer event raised");
      CurvePoint[][] lPoints = new CurvePoint[cNumTasks][];
      ParallelLoopResult lResult = Parallel.For(0, cNumTasks, (xInt) => DoSomething(xInt, xWakeUpTimeInTicks, lPoints));

      // the first measurement is not precise, so we discard it
      if (_Once) {
        _Once = false;
        return;
      }

      double lCallNo = _NumberOfMicroTimerCalls++;
      lCallNo /= cNumTriggers;

      _ViewModel.AddNewCurves(lPoints, lCallNo);
    } //

    private void DoSomething(int xId, long xWakeUpTimeInTicks, CurvePoint[][] xPoints) {
      // time sensitive stuff first
      double lFromTicks = Stopwatch.GetTimestamp();
      Thread.Sleep(10);
      double lToTicks = Stopwatch.GetTimestamp();

      // time insensitive stuff
      double lFromMillisecs = (lFromTicks - xWakeUpTimeInTicks) / Stopwatch.Frequency * 1000.0;
      double lToMillisecs = (lToTicks - xWakeUpTimeInTicks) / Stopwatch.Frequency * 1000.0;
      CurvePoint lFrom = new CurvePoint(xId, lFromMillisecs);
      CurvePoint lTo = new CurvePoint(xId, lToMillisecs);
      xPoints[xId] = new CurvePoint[] { lFrom, lTo };
    } //

  } // class
} // namespace
using System;
using System.Windows.Data;

namespace Demo {
  public class MyLabelConverter : IValueConverter {

    public object Convert(object value, Type targetType, object parameter, System.Globalization.CultureInfo culture) {
      if (value is double) return "Label " + ((double)value).ToString("0");
      return "#N/A";
    } //

    public object ConvertBack(object value, Type targetType, object parameter, System.Globalization.CultureInfo culture) {
      throw new NotImplementedException();
    } //

  } // class
} // namespace
using System;
using System.Collections.ObjectModel;
using System.Windows;
using System.Windows.Controls;
using System.Windows.Controls.DataVisualization.Charting;
using System.Windows.Data;
using System.Windows.Media;
using System.Windows.Shapes;

namespace Demo {

  public class ViewModel : DependencyObject {
    private readonly MainWindow _MainWindow;
    public readonly ObservableCollection<InfoText> Messages = new ObservableCollection<InfoText>();

    public ViewModel(MainWindow xMainWindow) {
      _MainWindow = xMainWindow;
      _MainWindow.InfoText.ItemsSource = Messages;
    } // constructor

    public void AddNewCurves(CurvePoint[][] xCurvePoints, double xYShift) {
      if (!Dispatcher.CheckAccess()) {
        Action lAction = () => { AddNewCurves(xCurvePoints, xYShift); };
        App.Current.Dispatcher.BeginInvoke(lAction);
        return;
      }

      // find the Y axis
      LinearAxis lYAxis = null;
      foreach (IAxis lAxis in _MainWindow.myChart.Axes) {
        if (lAxis.Orientation != AxisOrientation.Y) continue;
        lYAxis = lAxis as LinearAxis;
      }

      int lCount = xCurvePoints.GetUpperBound(0);
      LineSeries[] lLineSeries = new LineSeries[lCount];
      for (int x = 0, n = lCount; x < n; x++) {
        LineSeries lLine = new LineSeries();
        lLineSeries[x] = lLine;
        lLine.DependentRangeAxis = lYAxis;

        lLine.Title = "manually added curve";
        lLine.SetBinding(LineSeries.ItemsSourceProperty, new Binding());

        lLine.IndependentValueBinding = new Binding("Time");
        lLine.DependentValueBinding = new Binding("CurveId");

        Style lLineStyle = new Style(typeof(Polyline));
        //lLineStyle.Setters.Add(new Setter(Polyline.StrokeStartLineCapProperty, PenLineCap.Flat));
        //lLineStyle.Setters.Add(new Setter(Polyline.StrokeEndLineCapProperty, PenLineCap.Triangle));

        Style lPointStyle = new Style(typeof(DataPoint));

        if (xYShift == 0.0) {
          lLineStyle.Setters.Add(new Setter(Polyline.StrokeThicknessProperty, 3.0));
          lPointStyle.Setters.Add(new Setter(DataPoint.WidthProperty, 0.0));
          lPointStyle.Setters.Add(new Setter(DataPoint.BackgroundProperty, new SolidColorBrush(Colors.LightGreen)));
        }
        else {
          lLineStyle.Setters.Add(new Setter(Polyline.StrokeThicknessProperty, 1.0));
          lPointStyle.Setters.Add(new Setter(DataPoint.WidthProperty, 0.0));
          lPointStyle.Setters.Add(new Setter(DataPoint.BackgroundProperty, new SolidColorBrush(Colors.Black)));
        }
        lLine.PolylineStyle = lLineStyle;
        lLine.DataPointStyle = lPointStyle;

        xCurvePoints[x][0].CurveId -= xYShift;
        xCurvePoints[x][1].CurveId -= xYShift;
        lLine.ItemsSource = xCurvePoints[x];
        _MainWindow.myChart.Series.Add(lLine);
      }
    } //

    public void AddInfoText(string xText) {
      InfoText lInfoText = new InfoText(xText);
      Action lAction = () => {
        Messages.Add(lInfoText);

        // and scroll to the end
        if (_MainWindow.InfoText.Items.Count <= 0) return;
        Decorator lDecorator = VisualTreeHelper.GetChild(_MainWindow.InfoText, 0) as Decorator;
        if (lDecorator == null) return;
        ScrollViewer lScrollViewer = lDecorator.Child as ScrollViewer;
        if (lScrollViewer == null) return;
        lScrollViewer.ScrollToEnd();
      };
      App.Current.Dispatcher.BeginInvoke(lAction);
    } //

  } // class
} // namespace
WPF Charts (Part 4)
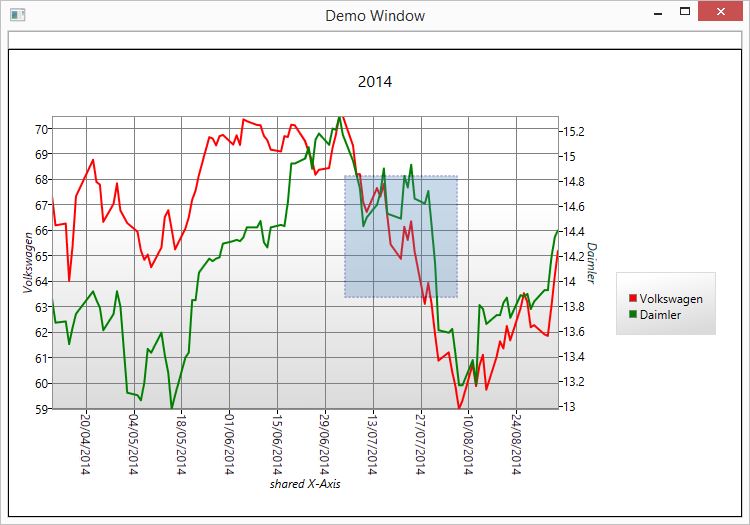
This post is about zooming.
You can draw a transparent rectangle, which will then determine the coordinates. To achieve this a WPF Canvas is used. It is invisible and is located directly above the chart. You cannot draw custom rectangles into the chart directly. Overlaying is no issue in WPF. The bubbling/tunneling does a fabulous job and avoids disabling any overlaid object. See Routed Events.
First I was planning a real-time zoom with two fingers. Touch-Screens are quite common these days. Performance issues quickly forced me to think about it all over again. In this example you can zoom by using the mouse or two fingers. There is no real-time zoom. You draw the rectangle and when you are done, then the coordinates on the chart are determined. Before this point in time it is just a plain rectangle object on a canvas with no real link to the chart. The escape button resets the axes/unzooms the chart.
I encapsulated the required functionality into a Zoom class. Yes, it maybe should have been in the ViewModel. I got the idea that it was neither fish nor meat – somewhere in between: “fieat”. Whatever, the Zoom class itself is clean and easy to understand.
There are some throttles in the code. They are definitely needed. The amount of touch events can easily become a “no-go” factor. You don’t have to process them all. Your eyes cannot perceive the vast amount of updates anyway. And WPF does not update the screen fast enough to show each value.
Oh, and one more issue here. I chose to not create a separate class to store the finger positions and rather go for a Tuple, which stores two values in an immutable way. The Tuple itself is declared only once. You find the declaration in the usings of the Zoom class.
using myTuple = System.Tuple<int, System.Windows.Point>;
In theory you can simultaneously have a lot of fingers on the screen; 10 if I am not mistaken 😉
You would store these in a dictionary. In this example I only concentrate on 2 fingers.
Personally, I prefer the mouse solution. The touch events are nice, but the performance is jerky. It seems that you would get better result by using only one finger and dragging it like a mouse pointer.
For learning purposes I am displaying the finger manipulation values in today’s example. Uncomment them or uncomment the rectangle code to play with it properly. You might realise that the vertical zoom factor equals the horizontal zoom factor. Call it a bug or a Microsoft flaw. Yes, this is annoying. Anyway, I guess these people don’t do things without any reason. So their sins are forgiven.
<Window x:Class="Demo.MainWindow"
    xmlns="http://schemas.microsoft.com/winfx/2006/xaml/presentation"
    xmlns:x="http://schemas.microsoft.com/winfx/2006/xaml"
    xmlns:local="clr-namespace:Demo"
    xmlns:datavisualization="clr-namespace:System.Windows.Controls.DataVisualization;assembly=System.Windows.Controls.DataVisualization.Toolkit"
    xmlns:chart="clr-namespace:System.Windows.Controls.DataVisualization.Charting;assembly=System.Windows.Controls.DataVisualization.Toolkit"
    Title="Demo Window"
    PreviewKeyDown="OnKeyDown"
    Loaded ="Window_Loaded">

  <DockPanel LastChildFill="True">
    <TextBox Name="InfoBox" Text="{Binding InfoBoxText, Mode=OneWay}" Height="Auto" DockPanel.Dock="Top"/>
    <Canvas DockPanel.Dock="Top" IsHitTestVisible="True"
            MouseDown="OnMouseLeftButtonDown"
            MouseLeftButtonUp="OnMouseLeftButtonUp"
            MouseMove="OnMouseMove"
            IsManipulationEnabled="True"
            ManipulationDelta="OnManipulationDelta"
            TouchDown="OnTouchDown"
            TouchMove="OnTouchMove"
            TouchUp="OnTouchUp"
            Width="Auto" Height="Auto" MinWidth="400" MinHeight="300">
      <chart:Chart Name="myChart" Title="2014"
                Width="{Binding RelativeSource={RelativeSource FindAncestor, AncestorType={x:Type Canvas}}, Path=ActualWidth}"
                Height="{Binding RelativeSource={RelativeSource FindAncestor, AncestorType={x:Type Canvas}}, Path=ActualHeight}">

        <chart:LineSeries Title="Volkswagen"
                          ItemsSource="{Binding Points}"
                          IndependentValueBinding="{Binding Date}"
                          DependentValueBinding="{Binding PriceVW}"
                          MouseMove="OnMouseMove">
          <chart:LineSeries.DependentRangeAxis>
            <chart:LinearAxis Orientation="Y"
                              Title="Volkswagen"
                              ShowGridLines="True" />
          </chart:LineSeries.DependentRangeAxis>
          <chart:LineSeries.DataPointStyle>
            <Style TargetType="{x:Type chart:LineDataPoint}">
              <Setter Property="Background" Value="Red" />
              <Setter Property="Height" Value="0"/>
              <Setter Property="Width" Value="0"/>
            </Style>
          </chart:LineSeries.DataPointStyle>
        </chart:LineSeries>

        <chart:LineSeries Title="Daimler"
                          ItemsSource="{Binding Points}"
                          IndependentValueBinding="{Binding Date}"
                          DependentValueBinding="{Binding PriceDaimler}">
          <chart:LineSeries.DependentRangeAxis>
            <chart:LinearAxis Orientation="Y" Title="Daimler" />
          </chart:LineSeries.DependentRangeAxis>
          <chart:LineSeries.DataPointStyle>
            <Style TargetType="{x:Type chart:LineDataPoint}">
              <Setter Property="Background" Value="Green" />
              <Setter Property="Height" Value="0"/>
              <Setter Property="Width" Value="0"/>
            </Style>
          </chart:LineSeries.DataPointStyle>
        </chart:LineSeries>

        <chart:Chart.Axes>
          <chart:DateTimeAxis Name="SharedXAxis"
                              Orientation="X"
                              Title="shared X-Axis"
                              ShowGridLines="True">

            <!--rotate the X-Axis labels -->
            <chart:DateTimeAxis.AxisLabelStyle>
              <Style TargetType="chart:DateTimeAxisLabel">
                <Setter Property="Template">
                  <Setter.Value>
                    <ControlTemplate TargetType="chart:DateTimeAxisLabel">
                      <TextBlock Text="{TemplateBinding FormattedContent}">
                        <TextBlock.LayoutTransform>
                          <RotateTransform Angle="90" CenterX = "40" CenterY = "30"/>
                        </TextBlock.LayoutTransform>
                      </TextBlock>
                    </ControlTemplate>
                  </Setter.Value>
                </Setter>
              </Style>
            </chart:DateTimeAxis.AxisLabelStyle>

          </chart:DateTimeAxis>
        </chart:Chart.Axes>
      </chart:Chart>

    </Canvas>
  </DockPanel>
</Window>
using System;
using System.Windows;
using System.Windows.Controls.DataVisualization.Charting;

namespace Demo {

  public class AxisPointLinear : AxisPoint {
    public readonly LinearAxis Axis;
    public readonly double Min;
    public readonly double Max;  // larger than Min;
    public readonly double Range;
    public readonly double MouseAxisValueAbsolute;

    public AxisPointLinear(Chart xChart, LinearAxis xAxis, Point xPoint, double xMin, double xMax)
      : base(xChart, xAxis, xPoint) {
      Min = xMin;
      Max = xMax;
      Range = xMax - xMin;
      Axis = xAxis;
      MouseAxisValueAbsolute = xMin + (MouseAxisValueRelative * Range);
    } // constructor

    public override string ToString() {
      string s = "Mouse: ";
      s += MouseAxisValueRelative.ToString("0.000%");
      s += "  =>  ";
      s += MouseAxisValueAbsolute.ToString("#,##0.000");
      s += " EUR for ";
      s += Axis.Orientation;
      s += "-Axis ";
      s += Axis.Title;
      return s;
    } //

  } // class

  public class AxisPointDateTime : AxisPoint {
    public readonly DateTimeAxis Axis;
    public readonly DateTime Min;
    public readonly DateTime Max;  // larger than Min;
    public readonly TimeSpan Range;
    public readonly DateTime MouseAxisValueAbsolute;

    public AxisPointDateTime(Chart xChart, DateTimeAxis xAxis, Point xPoint, DateTime xMin, DateTime xMax)
      : base(xChart, xAxis, xPoint) {
      Min = xMin;
      Max = xMax;
      Range = xMax - xMin;
      Axis = xAxis;
      MouseAxisValueAbsolute = xMin.AddMinutes(MouseAxisValueRelative * Range.TotalMinutes);
    } // constructor

    public override string ToString() {
      string s = "Mouse: ";
      s += MouseAxisValueRelative.ToString("0.000%");
      s += "  =>  ";
      s += MouseAxisValueAbsolute.ToString("dd MMM yyyy");
      s += " for ";
      s += Axis.Orientation;
      s += "-Axis ";
      s += Axis.Title;
      return s;
    } //

  } // class

  public class AxisPointFactory {
    public static AxisPoint getAxisPoint(Chart xChart, RangeAxis xAxis, Point xPoint) {
      if (xAxis == null) return null;

      if (xAxis is LinearAxis) {
        // some redundant basic checks
        LinearAxis lAxis = xAxis as LinearAxis;
        double? lMin;
        double? lMax;
        lMin = lAxis.ActualMinimum;
        lMax = lAxis.ActualMaximum;

        if ((!lMin.HasValue) || (!lMax.HasValue)) return null;
        if (lMin.Value >= lMax.Value) return null;

        return new AxisPointLinear(xChart, lAxis, xPoint, lMin.Value, lMax.Value);
      }
      if (xAxis is DateTimeAxis) {
        // some redundant basic checks
        DateTimeAxis lAxis = xAxis as DateTimeAxis;
        DateTime? lMin;
        DateTime? lMax;
        lMin = lAxis.ActualMinimum;
        lMax = lAxis.ActualMaximum;

        if ((!lMin.HasValue) || (!lMax.HasValue)) return null;
        if (lMin.Value >= lMax.Value) return null;

        return new AxisPointDateTime(xChart, lAxis, xPoint, lMin.Value, lMax.Value);
      }

      throw new Exception("Axis type not supported yet.");
    } //
  } // class

  public abstract class AxisPoint {
    public readonly Chart Chart;
    public readonly Point MouseAbsoluteLocation;
    public readonly double MouseAxisValueRelative;  // a number between 0% and 100%
    public readonly double Length;  // object pixel display units, larger than zero

    public AxisPoint(Chart xChart, RangeAxis xAxis, Point xPoint) {
      if (xAxis.Orientation == AxisOrientation.X) Length = xAxis.ActualWidth;
      else Length = xAxis.ActualHeight;

      if (Length <= 0) throw new Exception("Chart object length is zero or less.");

      MouseAbsoluteLocation = xChart.TranslatePoint(xPoint, xAxis);
      if (xAxis.Orientation == AxisOrientation.X) MouseAxisValueRelative = MouseAbsoluteLocation.X / Length;
      else MouseAxisValueRelative = 1.0 - (MouseAbsoluteLocation.Y / Length);

      if (MouseAxisValueRelative > 1.0) MouseAxisValueRelative = 1.0;
      else if (MouseAxisValueRelative < 0.0) MouseAxisValueRelative = 0.0;
    } // constructor

  } // class
} // namespace
using System;
using System.Windows;
using System.Windows.Input;

namespace Demo {

  public partial class MainWindow : Window {

    private Model _Model;
    private ViewModel _ViewModel;
    private Zoom _Zoom;

    public MainWindow() {
      InitializeComponent();
    } // constructor

    private void Window_Loaded(object sender, RoutedEventArgs e) {
      _Zoom = new Zoom(myChart);
      _ViewModel = new ViewModel(myChart);
      DataContext = _ViewModel;
      _Model = new Model(_ViewModel);
    } //

    private void OnKeyDown(object xSender, KeyEventArgs e) { _Zoom.OnKeyDown(xSender, e); }

    private void OnMouseLeftButtonDown(object xSender, MouseButtonEventArgs e) { _Zoom.OnMouseLeftButtonDown(xSender, e); }
    private void OnMouseLeftButtonUp(object xSender, MouseButtonEventArgs e) { _Zoom.OnMouseLeftButtonUp(xSender, e); }
    private void OnMouseMove(object xSender, MouseEventArgs e) { _Zoom.OnMouseMove(xSender, e); }

    private void OnTouchDown(object xSender, TouchEventArgs e) { _Zoom.OnTouchDown(xSender, e); }
    private void OnTouchMove(object xSender, TouchEventArgs e) { _Zoom.OnTouchMove(xSender, e); }
    private void OnTouchUp(object xSender, TouchEventArgs e) { _Zoom.OnTouchUp(xSender, e); }

    DateTime _LastOnManipulationDelta;
    private void OnManipulationDelta(object sender, ManipulationDeltaEventArgs e) {
      if (DateTime.Now.Subtract(_LastOnManipulationDelta).TotalMilliseconds < 500) return;  // throttle
      _LastOnManipulationDelta = DateTime.Now;

      InfoBox.Text =
            "Expansion: " + e.CumulativeManipulation.Expansion.ToString() + Environment.NewLine +
            "Rotation: " + e.CumulativeManipulation.Rotation.ToString() + Environment.NewLine +
            "Scale: " + e.CumulativeManipulation.Scale.ToString() + Environment.NewLine +
            "Translation: " + e.CumulativeManipulation.Translation.ToString() + Environment.NewLine +
            "Exp " + e.CumulativeManipulation.Expansion.X + "/" + e.CumulativeManipulation.Expansion.Y;
    } //

  } // class
} // namespace
using System;
using System.Linq;
using System.Windows.Threading;

namespace Demo {
  public class Model {
    private ViewModel _ViewModel;

    public Model(ViewModel xViewModel) {
      _ViewModel = xViewModel;
      //DispatcherTimer lTimer = new DispatcherTimer();
      //lTimer.Interval = new TimeSpan(0, 0, 3);
      //lTimer.Tick += new EventHandler(Timer_Tick);
      //lTimer.Start();
    } // constructor

    //void Timer_Tick(object sender, EventArgs e) {
    //    Random r = new Random();
    //    PriceCluster lPriceCluster = _ViewModel.Points.Last();
    //    double lVW = lPriceCluster.PriceVW * (1 + ((2.0 * (r.NextDouble() - 0.5)) / 30.0));
    //    double lDaimler = lPriceCluster.PriceDaimler * (1 + ((2.0 * (r.NextDouble() - 0.5)) / 30.0));
    //    _ViewModel.AddPoint(lPriceCluster.Date.AddDays(1), lVW, lDaimler);
    //} //

  } // class
} // namespace
using System;

namespace Demo {

  public class PriceCluster {
    public DateTime Date { get; set; }
    public double PriceVW { get; set; }
    public double PriceDaimler { get; set; }

    public PriceCluster(DateTime xDate, double xPriceVW, double xPriceDaimler) {
      Date = xDate;
      PriceVW = xPriceVW;
      PriceDaimler = xPriceDaimler;
    } // constructor
  } // class

  public class PriceClusterSimple {
    public DateTime Date { get; set; }
    public double Price { get; set; }

    public PriceClusterSimple(DateTime xDate, double xPrice) {
      Date = xDate;
      Price = xPrice;
    } // constructor
  } // class

} // namespace
using System;
using System.Collections.ObjectModel;
using System.Windows.Controls.DataVisualization.Charting;
using System.Windows;
using System.Windows.Input;
using System.Collections.Generic;

namespace Demo {
  using myTuple = Tuple<AxisPointDateTime, AxisPointLinear>;
  using System.Windows.Threading;

  public class ViewModel : DependencyObject {
    private readonly Chart _Chart;

    public ReadOnlyObservableCollection<PriceCluster> Points { get; private set; }
    private ObservableCollection<PriceCluster> _Points = new ObservableCollection<PriceCluster>();

    public ViewModel(Chart xChart) {
      _Chart = xChart;

      AddPoint(new DateTime(2014, 04, 10), 67.29, 13.85);
      AddPoint(new DateTime(2014, 04, 11), 66.15, 13.66);
      AddPoint(new DateTime(2014, 04, 14), 66.22, 13.67);
      AddPoint(new DateTime(2014, 04, 15), 63.99, 13.49);
      AddPoint(new DateTime(2014, 04, 16), 65.32, 13.62);
      AddPoint(new DateTime(2014, 04, 17), 67.29, 13.73);
      AddPoint(new DateTime(2014, 04, 22), 68.72, 13.91);
      AddPoint(new DateTime(2014, 04, 23), 67.85, 13.84);
      AddPoint(new DateTime(2014, 04, 24), 67.75, 13.78);
      AddPoint(new DateTime(2014, 04, 25), 66.29, 13.60);
      AddPoint(new DateTime(2014, 04, 28), 66.99, 13.73);
      AddPoint(new DateTime(2014, 04, 29), 67.79, 13.91);
      AddPoint(new DateTime(2014, 04, 30), 66.73, 13.79);
      AddPoint(new DateTime(2014, 05, 02), 66.24, 13.10);
      AddPoint(new DateTime(2014, 05, 05), 65.90, 13.08);
      AddPoint(new DateTime(2014, 05, 06), 65.16, 13.04);
      AddPoint(new DateTime(2014, 05, 07), 64.80, 13.18);
      AddPoint(new DateTime(2014, 05, 08), 65.00, 13.45);
      AddPoint(new DateTime(2014, 05, 09), 64.52, 13.42);
      AddPoint(new DateTime(2014, 05, 12), 65.28, 13.58);
      AddPoint(new DateTime(2014, 05, 13), 66.48, 13.40);
      AddPoint(new DateTime(2014, 05, 14), 66.74, 13.26);
      AddPoint(new DateTime(2014, 05, 15), 66.00, 12.97);
      AddPoint(new DateTime(2014, 05, 16), 65.21, 13.08);
      AddPoint(new DateTime(2014, 05, 19), 66.02, 13.38);
      AddPoint(new DateTime(2014, 05, 20), 66.46, 13.42);
      AddPoint(new DateTime(2014, 05, 21), 67.15, 13.84);
      AddPoint(new DateTime(2014, 05, 22), 67.52, 13.84);
      AddPoint(new DateTime(2014, 05, 23), 68.14, 14.06);
      AddPoint(new DateTime(2014, 05, 26), 69.61, 14.17);
      AddPoint(new DateTime(2014, 05, 27), 69.56, 14.15);
      AddPoint(new DateTime(2014, 05, 28), 69.29, 14.17);
      AddPoint(new DateTime(2014, 05, 29), 69.65, 14.18);
      AddPoint(new DateTime(2014, 05, 30), 69.70, 14.29);
      AddPoint(new DateTime(2014, 06, 02), 69.32, 14.31);
      AddPoint(new DateTime(2014, 06, 03), 69.68, 14.32);
      AddPoint(new DateTime(2014, 06, 04), 69.31, 14.31);
      AddPoint(new DateTime(2014, 06, 05), 70.31, 14.34);
      AddPoint(new DateTime(2014, 06, 06), 70.24, 14.42);
      AddPoint(new DateTime(2014, 06, 09), 70.09, 14.42);
      AddPoint(new DateTime(2014, 06, 10), 70.08, 14.47);
      AddPoint(new DateTime(2014, 06, 11), 69.66, 14.30);
      AddPoint(new DateTime(2014, 06, 12), 69.49, 14.26);
      AddPoint(new DateTime(2014, 06, 13), 69.12, 14.42);
      AddPoint(new DateTime(2014, 06, 16), 69.05, 14.44);
      AddPoint(new DateTime(2014, 06, 17), 69.65, 14.43);
      AddPoint(new DateTime(2014, 06, 18), 69.62, 14.62);
      AddPoint(new DateTime(2014, 06, 19), 70.10, 14.93);
      AddPoint(new DateTime(2014, 06, 20), 70.08, 14.93);
      AddPoint(new DateTime(2014, 06, 23), 69.46, 14.97);
      AddPoint(new DateTime(2014, 06, 24), 69.04, 15.06);
      AddPoint(new DateTime(2014, 06, 25), 68.71, 14.89);
      AddPoint(new DateTime(2014, 06, 26), 68.14, 15.12);
      AddPoint(new DateTime(2014, 06, 27), 68.33, 15.17);
      AddPoint(new DateTime(2014, 06, 30), 68.40, 15.08);
      AddPoint(new DateTime(2014, 07, 01), 69.19, 15.21);
      AddPoint(new DateTime(2014, 07, 02), 69.72, 15.20);
      AddPoint(new DateTime(2014, 07, 03), 70.44, 15.31);
      AddPoint(new DateTime(2014, 07, 04), 70.44, 15.16);
      AddPoint(new DateTime(2014, 07, 07), 69.28, 14.95);
      AddPoint(new DateTime(2014, 07, 08), 68.15, 14.84);
      AddPoint(new DateTime(2014, 07, 09), 68.16, 14.73);
      AddPoint(new DateTime(2014, 07, 10), 67.05, 14.43);
      AddPoint(new DateTime(2014, 07, 11), 66.68, 14.50);
      AddPoint(new DateTime(2014, 07, 14), 67.61, 14.60);
      AddPoint(new DateTime(2014, 07, 15), 67.28, 14.70);
      AddPoint(new DateTime(2014, 07, 16), 67.77, 14.89);
      AddPoint(new DateTime(2014, 07, 17), 66.56, 14.53);
      AddPoint(new DateTime(2014, 07, 18), 65.40, 14.52);
      AddPoint(new DateTime(2014, 07, 21), 64.84, 14.49);
      AddPoint(new DateTime(2014, 07, 22), 66.09, 14.83);
      AddPoint(new DateTime(2014, 07, 23), 65.58, 14.74);
      AddPoint(new DateTime(2014, 07, 24), 66.30, 14.92);
      AddPoint(new DateTime(2014, 07, 25), 65.15, 14.65);
      AddPoint(new DateTime(2014, 07, 28), 63.08, 14.61);
      AddPoint(new DateTime(2014, 07, 29), 63.89, 14.71);
      AddPoint(new DateTime(2014, 07, 30), 63.07, 14.43);
      AddPoint(new DateTime(2014, 07, 31), 61.88, 14.13);
      AddPoint(new DateTime(2014, 08, 01), 60.85, 13.60);
      AddPoint(new DateTime(2014, 08, 04), 61.17, 13.58);
      AddPoint(new DateTime(2014, 08, 05), 60.43, 13.61);
      AddPoint(new DateTime(2014, 08, 06), 59.82, 13.40);
      AddPoint(new DateTime(2014, 08, 07), 58.95, 13.16);
      AddPoint(new DateTime(2014, 08, 08), 59.27, 13.16);
      AddPoint(new DateTime(2014, 08, 11), 60.71, 13.36);
      AddPoint(new DateTime(2014, 08, 12), 59.85, 13.17);
      AddPoint(new DateTime(2014, 08, 13), 60.66, 13.80);
      AddPoint(new DateTime(2014, 08, 14), 61.07, 13.77);
      AddPoint(new DateTime(2014, 08, 15), 59.71, 13.65);
      AddPoint(new DateTime(2014, 08, 18), 60.99, 13.72);
      AddPoint(new DateTime(2014, 08, 19), 61.60, 13.72);
      AddPoint(new DateTime(2014, 08, 20), 61.33, 13.82);
      AddPoint(new DateTime(2014, 08, 21), 62.20, 13.86);
      AddPoint(new DateTime(2014, 08, 22), 61.65, 13.70);
      AddPoint(new DateTime(2014, 08, 25), 62.88, 13.88);
      AddPoint(new DateTime(2014, 08, 26), 63.49, 13.87);
      AddPoint(new DateTime(2014, 08, 27), 63.15, 13.89);
      AddPoint(new DateTime(2014, 08, 28), 62.16, 13.77);
      AddPoint(new DateTime(2014, 08, 29), 62.24, 13.83);
      AddPoint(new DateTime(2014, 09, 01), 61.88, 13.92);
      AddPoint(new DateTime(2014, 09, 02), 61.82, 13.92);
      AddPoint(new DateTime(2014, 09, 03), 62.90, 14.17);
      AddPoint(new DateTime(2014, 09, 04), 64.14, 14.34);
      AddPoint(new DateTime(2014, 09, 05), 65.17, 14.40);

      Points = new ReadOnlyObservableCollection<PriceCluster>(_Points);
    } // constructor

    // only to be called from the dispatcher thread!
    public void AddPoint(DateTime xDate, double xPriceVW, double xPriceDaimler) {
      _Points.Add(new PriceCluster(xDate, xPriceVW, xPriceDaimler));
    } //


  } // class
} // namespace
using System;
using System.Windows;
using System.Windows.Controls;
using System.Windows.Controls.DataVisualization.Charting;
using System.Windows.Input;
using System.Windows.Media;
using System.Windows.Shapes;
using myTuple = System.Tuple<int, System.Windows.Point>;

namespace Demo {
  public class Zoom {

    private Rectangle _Rectangle = null;
    private myTuple _PointA = null;
    private myTuple _PointB = null; // only used for the fingers, not for the mouse
    private readonly Chart _Chart;

    public Zoom(Chart xChart) {
      _Chart = xChart;
    } //

    #region draw new rectangle on button or finger down

    public void OnMouseLeftButtonDown(object xSender, MouseButtonEventArgs e) {
      Canvas lCanvas = xSender as Canvas;
      if (lCanvas == null) return;
      Point lPointA = e.GetPosition(lCanvas);

      DrawNewRectangle(lCanvas, lPointA, -1);
    } //

    public void OnTouchDown(object xSender, TouchEventArgs e) {
      Canvas lCanvas = xSender as Canvas;
      if (lCanvas == null) return;

      TouchPoint lTouchPoint = e.GetTouchPoint(lCanvas);
      if (lTouchPoint == null) return;

      myTuple lTuple = _PointA;
      if (lTuple != null) {
        if (lTuple.Item1 == e.TouchDevice.Id) return; // this was finger 1, not going to happen anyway as it cannot touchdown twice
        Point lPointA = lTuple.Item2;

        // store second finger; we don't care about its ID, so it could also be finger 3, 4 or 5 ...
        Point lPointB = lTouchPoint.Position;
        _PointB = new myTuple(e.TouchDevice.Id, lPointB);
        RedrawRectangle(lPointA, lPointB);
        return;
      }

      // first finger
      DrawNewRectangle(lCanvas, lTouchPoint.Position, lTouchPoint.TouchDevice.Id);
      return;
    } //

    private void DrawNewRectangle(Canvas xCanvas, Point xPoint, int xPointId) {
      if (_Rectangle != null) return;

      _Rectangle = new Rectangle();

      Point lPointA = new Point(xPoint.X, xPoint.Y); // clone
      _PointA = new myTuple(xPointId, lPointA);
      xCanvas.Children.Add(_Rectangle);

      Canvas.SetLeft(_Rectangle, xPoint.X);
      Canvas.SetTop(_Rectangle, xPoint.Y);

      _Rectangle.Height = 1.0;
      _Rectangle.Width = 1.0;
      _Rectangle.Opacity = 0.3;
      _Rectangle.Fill = new SolidColorBrush(Colors.SteelBlue);
      _Rectangle.Stroke = new SolidColorBrush(Colors.DarkBlue);
      _Rectangle.StrokeDashArray = new DoubleCollection(new double[] { 0.5, 1.5 });
      _Rectangle.StrokeDashCap = PenLineCap.Round;
      _Rectangle.StrokeThickness = 2.0;
    } //
    #endregion


    #region resize rectangle on any movement

    public void OnMouseMove(object xSender, MouseEventArgs e) {
      if (!(xSender is Canvas)) return;
      myTuple lTuple = _PointA;
      if (lTuple == null) return;
      Point lPointA = lTuple.Item2;
      Point lPointB = e.GetPosition((Canvas)xSender);
      RedrawRectangle(lPointA, lPointB);
    } //

    DateTime _LastOnTouchMove;
    public void OnTouchMove(object xSender, TouchEventArgs e) {
      if (DateTime.Now.Subtract(_LastOnTouchMove).TotalMilliseconds < 300) return;  // throttle
      _LastOnTouchMove = DateTime.Now;

      Canvas lCanvas = xSender as Canvas;
      if (lCanvas == null) return;

      TouchPoint lTouchPoint = e.GetTouchPoint(lCanvas);
      if (lTouchPoint == null) return;

      myTuple lTuple = _PointA;
      if (lTuple == null) return;

      Point lPointA = lTuple.Item2;
      if (e.TouchDevice.Id == lTuple.Item1) {
        // this is the finger we were touching down first
        lPointA = lTouchPoint.Position;
        _PointA = new myTuple(e.TouchDevice.Id, lPointA);
      }

      lTuple = _PointB;
      if (lTuple == null) return; // no second finger

      Point lPointB = lTuple.Item2;
      if (e.TouchDevice.Id == lTuple.Item1) {
        // this was the second finger
        lPointB = lTouchPoint.Position;
        _PointB = new myTuple(e.TouchDevice.Id, lPointB);
      }

      RedrawRectangle(lPointA, lPointB);
    } //

    private void RedrawRectangle(Point xPointA, Point xPointB) {
      Rectangle lRectangle = _Rectangle;
      if (lRectangle == null) return;

      Canvas.SetTop(lRectangle, Math.Min(xPointA.Y, xPointB.Y));
      lRectangle.Height = Math.Abs(xPointA.Y - xPointB.Y);

      Canvas.SetLeft(lRectangle, Math.Min(xPointA.X, xPointB.X));
      lRectangle.Width = Math.Abs(xPointA.X - xPointB.X);
    } //

    #endregion

    #region remove rectangle and Zoom
    public void OnMouseLeftButtonUp(object xSender, MouseButtonEventArgs e) {
      Rectangle lRectangle = _Rectangle;
      RemoveRectangle(xSender);
      ProcessZoom(lRectangle);
    } //

    public void OnTouchUp(object xSender, TouchEventArgs e) {
      Rectangle lRectangle = _Rectangle;
      if (lRectangle == null) return; // do not process any results when the first finger was gone already
      RemoveRectangle(xSender);
      ProcessZoom(lRectangle);
    } //

    private void RemoveRectangle(object xSender) {
      Canvas lCanvas = xSender as Canvas;
      if (lCanvas == null) return;
      lCanvas.Children.Remove(_Rectangle);
      _PointA = null;
      _PointB = null;
      _Rectangle = null;
    } //

    public void ProcessZoom(Rectangle xRectangle) {
      if (xRectangle == null) return;
      Point lFrom = new Point(Canvas.GetLeft(xRectangle), Canvas.GetTop(xRectangle));
      Point lTo = new Point(lFrom.X + xRectangle.Width, lFrom.Y + xRectangle.Height);

      foreach (IAxis lAxis in _Chart.ActualAxes) {
        if (lAxis is LinearAxis) {
          LinearAxis lLinearAxis = lAxis as LinearAxis;
          AxisPointLinear a = AxisPointFactory.getAxisPoint(_Chart, lLinearAxis, lFrom) as AxisPointLinear;
          AxisPointLinear b = AxisPointFactory.getAxisPoint(_Chart, lLinearAxis, lTo) as AxisPointLinear;
          lLinearAxis.Minimum = Math.Min(a.MouseAxisValueAbsolute, b.MouseAxisValueAbsolute);
          lLinearAxis.Maximum = Math.Max(a.MouseAxisValueAbsolute, b.MouseAxisValueAbsolute);
          continue;
        }

        if (lAxis is DateTimeAxis) {
          DateTimeAxis lDateTimeAxis = lAxis as DateTimeAxis;
          AxisPointDateTime a = AxisPointFactory.getAxisPoint(_Chart, lDateTimeAxis, lFrom) as AxisPointDateTime;
          AxisPointDateTime b = AxisPointFactory.getAxisPoint(_Chart, lDateTimeAxis, lTo) as AxisPointDateTime;
          lDateTimeAxis.Minimum = a.MouseAxisValueAbsolute < b.MouseAxisValueAbsolute ? a.MouseAxisValueAbsolute : b.MouseAxisValueAbsolute;
          lDateTimeAxis.Maximum = a.MouseAxisValueAbsolute > b.MouseAxisValueAbsolute ? a.MouseAxisValueAbsolute : b.MouseAxisValueAbsolute;
          continue;
        }
      }
    } //
    #endregion

    #region reset Zoom
    public void OnKeyDown(object xSender, KeyEventArgs e) {
      if (e.Key != Key.Escape) return;

      ProcessZoomReset();
    } //

    public void ProcessZoomReset() {
      foreach (IAxis lAxis in _Chart.ActualAxes) {
        if (lAxis is LinearAxis) {
          LinearAxis lLinearAxis = lAxis as LinearAxis;
          lLinearAxis.Minimum = null;
          lLinearAxis.Maximum = null;
          continue;
        }

        if (lAxis is DateTimeAxis) {
          DateTimeAxis lDateTimeAxis = lAxis as DateTimeAxis;
          lDateTimeAxis.Minimum = null;
          lDateTimeAxis.Maximum = null;
          continue;
        }
      }
    } //
    #endregion

  } // class
} // namespace
WPF Charts (Part 3)

In my last post about charts I added a small feature to obtain object information of any chart element under the mouse cursor.
Today we are doing the next logical step. I added proper coordinates in axis units (here EUROs), time and percent units. You hover over the chart and you don’t have to stop at a specific point. The program tells you the position in relation to each axis. We have three of them, so make sure you read the right output. I believe this is more useful than just being able to read curve point hover events. Sometimes you want to know some values in between – in the middle of nowhere. And we are solving this problem now.
I kept the code flexible. There is barely any hard-coding. You might also realize some redundant checks. They may be stupid at this stage. But think practically; many people copy the code and change it according to their needs. You quickly forget implementing the little checks, which were not necessary in the first place.
Like in the last chart posts, we are dealing with two line curves. There is a third one today, which is generated at runtime. Have a look at the corresponding C# code. In hindsight it always gives a better understanding of XAML code. WPF is not as straight forward as WinForms. It requires some training here and there. For instance, you cannot simply change the height property of an object. You need to use the hard way via setters.
The third curve is a manual line. Use the left mouse button (OnMouseLeftButtonDown event) to draw it. When you do this for the first time, the line is added to the chart. It did not exist before and was not just hidden. The events OnMouseMove and OnMouseLeftButtonUp are used to complete the logic. All three are required to draw the line while the chart keeps on adding points in the background. A small bonus are the proper axis coordinates. Despite subsequent new points, which are timer based, the manual line remains scaled. The new curve is linked to the same axes as the first curve (search for: LineSeries lLineSeries = lChart.Series[0] as LineSeries; …. lRangeAxis = xLineSeries.ActualDependentRangeAxis as RangeAxis; … lAxisPoint = AxisPointFactory.getAxisPoint(lChart, lRangeAxis, lPoint); ).
<Window x:Class="Demo.MainWindow"
    xmlns="http://schemas.microsoft.com/winfx/2006/xaml/presentation"
    xmlns:x="http://schemas.microsoft.com/winfx/2006/xaml"
    xmlns:local="clr-namespace:Demo"
    xmlns:datavisualization="clr-namespace:System.Windows.Controls.DataVisualization;assembly=System.Windows.Controls.DataVisualization.Toolkit"
    xmlns:chart="clr-namespace:System.Windows.Controls.DataVisualization.Charting;assembly=System.Windows.Controls.DataVisualization.Toolkit"
    Title="Demo Window"
    Loaded ="Window_Loaded">

    <Grid>
        <TextBox Name="InfoBox" Text="" Height="Auto"/>
        <chart:Chart Name="myChart" Title="2014" Width="Auto" Height="Auto" MinWidth="400" MinHeight="300"
                     MouseMove="OnMouseMove"
                     MouseLeftButtonDown="OnMouseLeftButtonDown"
                     MouseLeftButtonUp="OnMouseLeftButtonUp">
            <chart:LineSeries Title="Volkswagen"
                              ItemsSource="{Binding Points}"
                              IndependentValueBinding="{Binding Date}"
                              DependentValueBinding="{Binding PriceVW}"
                              MouseMove="OnMouseMove">
                <chart:LineSeries.DependentRangeAxis>
                    <chart:LinearAxis Orientation="Y" Title="Volkswagen" ShowGridLines="True" />
                </chart:LineSeries.DependentRangeAxis>
                <chart:LineSeries.DataPointStyle>
                    <Style TargetType="{x:Type chart:LineDataPoint}">
                        <Setter Property="Background" Value="Red" />
                        <Setter Property="Height" Value="0"/>
                        <Setter Property="Width" Value="0"/>
                    </Style>
                </chart:LineSeries.DataPointStyle>
            </chart:LineSeries>

            <chart:LineSeries Title="Daimler"
                              ItemsSource="{Binding Points}"
                              IndependentValueBinding="{Binding Date}"
                              DependentValueBinding="{Binding PriceDaimler}">
                <chart:LineSeries.DependentRangeAxis>
                    <chart:LinearAxis Orientation="Y" Title="Daimler" />
                </chart:LineSeries.DependentRangeAxis>
                <chart:LineSeries.DataPointStyle>
                    <Style TargetType="{x:Type chart:LineDataPoint}">
                        <Setter Property="Background" Value="Green" />
                        <Setter Property="Height" Value="0"/>
                        <Setter Property="Width" Value="0"/>
                    </Style>
                </chart:LineSeries.DataPointStyle>
            </chart:LineSeries>

            <chart:Chart.Axes>
                <chart:DateTimeAxis Name="SharedXAxis"
                                   Orientation="X"
                                  Title="shared X-Axis"
                                  ShowGridLines="True">

                    <!--rotate the X-Axis labels -->
                    <chart:DateTimeAxis.AxisLabelStyle>
                        <Style TargetType="chart:DateTimeAxisLabel">
                            <Setter Property="Template">
                                <Setter.Value>
                                    <ControlTemplate TargetType="chart:DateTimeAxisLabel">
                                        <TextBlock Text="{TemplateBinding FormattedContent}">
                                            <TextBlock.LayoutTransform>
                                                <RotateTransform Angle="90" CenterX = "40" CenterY = "30"/>
                                            </TextBlock.LayoutTransform>
                                        </TextBlock>
                                    </ControlTemplate>
                                </Setter.Value>
                            </Setter>
                        </Style>
                    </chart:DateTimeAxis.AxisLabelStyle>

                </chart:DateTimeAxis>
            </chart:Chart.Axes>
        </chart:Chart>

    </Grid>
</Window>
using System;
using System.Collections.ObjectModel;
using System.Windows;
using System.Windows.Controls;
using System.Windows.Controls.DataVisualization.Charting;
using System.Windows.Data;
using System.Windows.Input;
using System.Windows.Media;

namespace Demo {
    public partial class MainWindow : Window {

        private Model _Model;
        private bool _DrawNewLine = false;

        public MainWindow() {
            InitializeComponent();
        } // constructor

        private void Window_Loaded(object sender, RoutedEventArgs e) {
            ViewModel lViewModel = new ViewModel(myChart);
            DataContext = lViewModel;
            _Model = new Model(lViewModel);
        } //

        private void OnMouseMove(object sender, MouseEventArgs e) {
            if ((!_DrawNewLine) && (e.LeftButton == MouseButtonState.Pressed)) {
                MouseButtonEventArgs lMouseButtonEventArgs = new MouseButtonEventArgs(e.MouseDevice, e.Timestamp, MouseButton.Left);
                OnMouseLeftButtonDown(sender, lMouseButtonEventArgs);
                return;
            }

            IInputElement lInputElement = sender as IInputElement; // == basically Chart or LineSeries
            Point lPoint = e.GetPosition(lInputElement);

            Chart lChart = sender as Chart;
            if (lChart != null) {
                string s = string.Empty;

                // iterate through all axes
                lock (lChart.ActualAxes) {
                    foreach (IAxis lAxis in lChart.ActualAxes) {
                        RangeAxis lRangeAxis = lAxis as RangeAxis;
                        if (lRangeAxis == null) continue; // won't happen
                        AxisPoint lAxisPoint = AxisPointFactory.getAxisPoint(lChart, lRangeAxis, lPoint);

                        s += lAxisPoint.ToString() + Environment.NewLine;
                    }
                }

                InfoBox.Text = s;
                return;
            }

            LineSeries lLineSeries = sender as LineSeries;
            if (lLineSeries != null) {
                IInputElement lSelection = lLineSeries.InputHitTest(lPoint);
                if (lSelection == null) return;
                InfoBox.Text = "LineSeries object: " + lSelection.GetType().ToString();
                return;
            }
        } //

        private void OnMouseLeftButtonDown(object sender, MouseButtonEventArgs e) {
            Chart lChart = sender as Chart;
            if (lChart == null) return;

            AxisPoint lAxisPointX;
            AxisPoint lAxisPointY;
            LineSeries lLineSeries = lChart.Series[0] as LineSeries;
            if (lLineSeries == null) return;   // won't happen anyway
            if (!getAxisPointsToDrawALine(sender, e, lLineSeries, out lAxisPointX, out lAxisPointY)) return;

            AxisPointDateTime lAxisPointDateTimeX = lAxisPointX as AxisPointDateTime;
            AxisPointLinear lAxisPointLinearY = lAxisPointY as AxisPointLinear;

            if (lAxisPointDateTimeX == null) return;  // Quick and dirty test. Should not happen anyway.
            if (lAxisPointLinearY == null) return;  // Might be helpful when you change the code and forget about this requirement in another scenario.

            DrawCurve_WPF_Runtime(lChart, lAxisPointDateTimeX, lAxisPointLinearY);
        } //

        // add a new curve and its first point
        private ObservableCollection<PriceClusterSimple> ManualPoints = null;
        private void DrawCurve_WPF_Runtime(Chart lChart, AxisPointDateTime lAxisPointDateTimeX, AxisPointLinear lAxisPointLinearY) {
            PriceClusterSimple lDataPoint = new PriceClusterSimple(lAxisPointDateTimeX.MouseAxisValueAbsolute, lAxisPointLinearY.MouseAxisValueAbsolute);

            if (ManualPoints != null) {
                if (_DrawNewLine) {
                    _DrawNewLine = false;
                    ManualPoints.Clear();
                    ManualPoints.Add(lDataPoint); // from
                    ManualPoints.Add(lDataPoint); // to
                }
                else {
                    ManualPoints.RemoveAt(1);
                    ManualPoints.Add(lDataPoint); // to
                }
                return;
            }

            ManualPoints = new ObservableCollection<PriceClusterSimple>();
            ManualPoints.Add(lDataPoint);
            ManualPoints.Add(lDataPoint);
            LineSeries lNewLineSeries = new LineSeries();
            lNewLineSeries.Title = "manually added curve";
            lNewLineSeries.SetBinding(LineSeries.ItemsSourceProperty, new Binding());
            lNewLineSeries.ItemsSource = ManualPoints;
            lNewLineSeries.IndependentValueBinding = new Binding("Date");
            lNewLineSeries.DependentValueBinding = new Binding("Price");
            lNewLineSeries.DependentRangeAxis = lAxisPointLinearY.Axis;
            Setter lHeightSetter = new Setter(FrameworkElement.HeightProperty, 0.0);
            Setter lWidthSetter = new Setter(FrameworkElement.WidthProperty, 0.0);
            Setter lColor = new Setter(Control.BackgroundProperty, new SolidColorBrush(Colors.Black));
            Style lStyle = new Style(typeof(Control));
            lNewLineSeries.DataPointStyle = lStyle;
            lStyle.Setters.Add(lHeightSetter);
            lStyle.Setters.Add(lWidthSetter);
            lStyle.Setters.Add(lColor);
            lChart.Series.Add(lNewLineSeries);
        } //

        private bool getAxisPointsToDrawALine(object xSender, MouseButtonEventArgs xMouseButtonEventArgs, LineSeries xLineSeries, out AxisPoint xAxisPointX, out AxisPoint xAxisPointY) {
            IInputElement lInputElement = xSender as IInputElement; // == basically Chart or LineSeries
            Point lPoint = xMouseButtonEventArgs.GetPosition(lInputElement);
            xAxisPointX = null;
            xAxisPointY = null;

            Chart lChart = xSender as Chart;
            if (lChart == null) return false;

            RangeAxis lRangeAxis;
            AxisPoint lAxisPoint;

            lRangeAxis = xLineSeries.ActualDependentRangeAxis as RangeAxis;
            if (lRangeAxis == null) return false; // won't happen in our example
            lAxisPoint = AxisPointFactory.getAxisPoint(lChart, lRangeAxis, lPoint);
            if (lRangeAxis.Orientation == AxisOrientation.X) xAxisPointX = lAxisPoint;
            else xAxisPointY = lAxisPoint;

            lRangeAxis = xLineSeries.ActualIndependentAxis as RangeAxis;
            if (lRangeAxis == null) return false; // won't happen in our example
            lAxisPoint = AxisPointFactory.getAxisPoint(lChart, lRangeAxis, lPoint);
            if (lRangeAxis.Orientation == AxisOrientation.X) xAxisPointX = lAxisPoint;
            else xAxisPointY = lAxisPoint;

            if ((xAxisPointX == null) || (xAxisPointY == null)) return false;
            return true;
        } //

        private void OnMouseLeftButtonUp(object sender, MouseButtonEventArgs e) {
            _DrawNewLine = true;
        } //

    } // class
} // namespace
using System;
using System.Linq;
using System.Windows.Threading;

namespace Demo {
	public class Model {
		private ViewModel _ViewModel;

		public Model(ViewModel xViewModel) {
			_ViewModel = xViewModel;
			DispatcherTimer lTimer = new DispatcherTimer();
			lTimer.Interval = new TimeSpan(0, 0, 3);
			lTimer.Tick += new EventHandler(Timer_Tick);
			lTimer.Start();
		} // constructor

		void Timer_Tick(object sender, EventArgs e) {
			Random r = new Random();
			PriceCluster lPriceCluster = _ViewModel.Points.Last();
			double lVW = lPriceCluster.PriceVW * (1 + ((2.0 * (r.NextDouble() - 0.5)) / 30.0));
			double lDaimler = lPriceCluster.PriceDaimler * (1 + ((2.0 * (r.NextDouble() - 0.5)) / 30.0));
			_ViewModel.AddPoint(lPriceCluster.Date.AddDays(1), lVW, lDaimler);
		} //

	} // class
} // namespace
using System;

namespace Demo {

    public class PriceCluster {
		public DateTime Date { get; set; }
		public double PriceVW { get; set; }
		public double PriceDaimler { get; set; }

		public PriceCluster(DateTime xDate, double xPriceVW, double xPriceDaimler) {
			Date = xDate;
			PriceVW = xPriceVW;
			PriceDaimler = xPriceDaimler;
		} // constructor
	} // class

    public class PriceClusterSimple {
        public DateTime Date { get; set; }
        public double Price { get; set; }

        public PriceClusterSimple(DateTime xDate, double xPrice) {
            Date = xDate;
            Price = xPrice;
        } // constructor
    } // class

} // namespace
using System;
using System.Collections.ObjectModel;
using System.Windows.Controls.DataVisualization.Charting;

namespace Demo {
	public class ViewModel {
		private readonly Chart _Chart;
		public ReadOnlyObservableCollection<PriceCluster> Points { get; private set; }
		private ObservableCollection<PriceCluster> _Points = new ObservableCollection<PriceCluster>();

		public ViewModel(Chart xChart) {
			_Chart = xChart;

			AddPoint(new DateTime(2014, 04, 10), 67.29, 13.85);
			AddPoint(new DateTime(2014, 04, 11), 66.15, 13.66);
			AddPoint(new DateTime(2014, 04, 14), 66.22, 13.67);
			AddPoint(new DateTime(2014, 04, 15), 63.99, 13.49);
			AddPoint(new DateTime(2014, 04, 16), 65.32, 13.62);
			AddPoint(new DateTime(2014, 04, 17), 67.29, 13.73);
			AddPoint(new DateTime(2014, 04, 22), 68.72, 13.91);
			AddPoint(new DateTime(2014, 04, 23), 67.85, 13.84);
			AddPoint(new DateTime(2014, 04, 24), 67.75, 13.78);
			AddPoint(new DateTime(2014, 04, 25), 66.29, 13.60);
			AddPoint(new DateTime(2014, 04, 28), 66.99, 13.73);
			AddPoint(new DateTime(2014, 04, 29), 67.79, 13.91);
			AddPoint(new DateTime(2014, 04, 30), 66.73, 13.79);
			AddPoint(new DateTime(2014, 05, 02), 66.24, 13.10);
			AddPoint(new DateTime(2014, 05, 05), 65.90, 13.08);
			AddPoint(new DateTime(2014, 05, 06), 65.16, 13.04);
			AddPoint(new DateTime(2014, 05, 07), 64.80, 13.18);
			AddPoint(new DateTime(2014, 05, 08), 65.00, 13.45);
			AddPoint(new DateTime(2014, 05, 09), 64.52, 13.42);
			AddPoint(new DateTime(2014, 05, 12), 65.28, 13.58);
			AddPoint(new DateTime(2014, 05, 13), 66.48, 13.40);
			AddPoint(new DateTime(2014, 05, 14), 66.74, 13.26);
			AddPoint(new DateTime(2014, 05, 15), 66.00, 12.97);
			AddPoint(new DateTime(2014, 05, 16), 65.21, 13.08);
			AddPoint(new DateTime(2014, 05, 19), 66.02, 13.38);
			AddPoint(new DateTime(2014, 05, 20), 66.46, 13.42);
			AddPoint(new DateTime(2014, 05, 21), 67.15, 13.84);
			AddPoint(new DateTime(2014, 05, 22), 67.52, 13.84);
			AddPoint(new DateTime(2014, 05, 23), 68.14, 14.06);
			AddPoint(new DateTime(2014, 05, 26), 69.61, 14.17);
			AddPoint(new DateTime(2014, 05, 27), 69.56, 14.15);
			AddPoint(new DateTime(2014, 05, 28), 69.29, 14.17);
			AddPoint(new DateTime(2014, 05, 29), 69.65, 14.18);
			AddPoint(new DateTime(2014, 05, 30), 69.70, 14.29);
			AddPoint(new DateTime(2014, 06, 02), 69.32, 14.31);
			AddPoint(new DateTime(2014, 06, 03), 69.68, 14.32);
			AddPoint(new DateTime(2014, 06, 04), 69.31, 14.31);
			AddPoint(new DateTime(2014, 06, 05), 70.31, 14.34);
			AddPoint(new DateTime(2014, 06, 06), 70.24, 14.42);
			AddPoint(new DateTime(2014, 06, 09), 70.09, 14.42);
			AddPoint(new DateTime(2014, 06, 10), 70.08, 14.47);
			AddPoint(new DateTime(2014, 06, 11), 69.66, 14.30);
			AddPoint(new DateTime(2014, 06, 12), 69.49, 14.26);
			AddPoint(new DateTime(2014, 06, 13), 69.12, 14.42);
			AddPoint(new DateTime(2014, 06, 16), 69.05, 14.44);
			AddPoint(new DateTime(2014, 06, 17), 69.65, 14.43);
			AddPoint(new DateTime(2014, 06, 18), 69.62, 14.62);
			AddPoint(new DateTime(2014, 06, 19), 70.10, 14.93);
			AddPoint(new DateTime(2014, 06, 20), 70.08, 14.93);
			AddPoint(new DateTime(2014, 06, 23), 69.46, 14.97);
			AddPoint(new DateTime(2014, 06, 24), 69.04, 15.06);
			AddPoint(new DateTime(2014, 06, 25), 68.71, 14.89);
			AddPoint(new DateTime(2014, 06, 26), 68.14, 15.12);
			AddPoint(new DateTime(2014, 06, 27), 68.33, 15.17);
			AddPoint(new DateTime(2014, 06, 30), 68.40, 15.08);
			AddPoint(new DateTime(2014, 07, 01), 69.19, 15.21);
			AddPoint(new DateTime(2014, 07, 02), 69.72, 15.20);
			AddPoint(new DateTime(2014, 07, 03), 70.44, 15.31);
			AddPoint(new DateTime(2014, 07, 04), 70.44, 15.16);
			AddPoint(new DateTime(2014, 07, 07), 69.28, 14.95);
			AddPoint(new DateTime(2014, 07, 08), 68.15, 14.84);
			AddPoint(new DateTime(2014, 07, 09), 68.16, 14.73);
			AddPoint(new DateTime(2014, 07, 10), 67.05, 14.43);
			AddPoint(new DateTime(2014, 07, 11), 66.68, 14.50);
			AddPoint(new DateTime(2014, 07, 14), 67.61, 14.60);
			AddPoint(new DateTime(2014, 07, 15), 67.28, 14.70);
			AddPoint(new DateTime(2014, 07, 16), 67.77, 14.89);
			AddPoint(new DateTime(2014, 07, 17), 66.56, 14.53);
			AddPoint(new DateTime(2014, 07, 18), 65.40, 14.52);
			AddPoint(new DateTime(2014, 07, 21), 64.84, 14.49);
			AddPoint(new DateTime(2014, 07, 22), 66.09, 14.83);
			AddPoint(new DateTime(2014, 07, 23), 65.58, 14.74);
			AddPoint(new DateTime(2014, 07, 24), 66.30, 14.92);
			AddPoint(new DateTime(2014, 07, 25), 65.15, 14.65);
			AddPoint(new DateTime(2014, 07, 28), 63.08, 14.61);
			AddPoint(new DateTime(2014, 07, 29), 63.89, 14.71);
			AddPoint(new DateTime(2014, 07, 30), 63.07, 14.43);
			AddPoint(new DateTime(2014, 07, 31), 61.88, 14.13);
			AddPoint(new DateTime(2014, 08, 01), 60.85, 13.60);
			AddPoint(new DateTime(2014, 08, 04), 61.17, 13.58);
			AddPoint(new DateTime(2014, 08, 05), 60.43, 13.61);
			AddPoint(new DateTime(2014, 08, 06), 59.82, 13.40);
			AddPoint(new DateTime(2014, 08, 07), 58.95, 13.16);
			AddPoint(new DateTime(2014, 08, 08), 59.27, 13.16);
			AddPoint(new DateTime(2014, 08, 11), 60.71, 13.36);
			AddPoint(new DateTime(2014, 08, 12), 59.85, 13.17);
			AddPoint(new DateTime(2014, 08, 13), 60.66, 13.80);
			AddPoint(new DateTime(2014, 08, 14), 61.07, 13.77);
			AddPoint(new DateTime(2014, 08, 15), 59.71, 13.65);
			AddPoint(new DateTime(2014, 08, 18), 60.99, 13.72);
			AddPoint(new DateTime(2014, 08, 19), 61.60, 13.72);
			AddPoint(new DateTime(2014, 08, 20), 61.33, 13.82);
			AddPoint(new DateTime(2014, 08, 21), 62.20, 13.86);
			AddPoint(new DateTime(2014, 08, 22), 61.65, 13.70);
			AddPoint(new DateTime(2014, 08, 25), 62.88, 13.88);
			AddPoint(new DateTime(2014, 08, 26), 63.49, 13.87);
			AddPoint(new DateTime(2014, 08, 27), 63.15, 13.89);
			AddPoint(new DateTime(2014, 08, 28), 62.16, 13.77);
			AddPoint(new DateTime(2014, 08, 29), 62.24, 13.83);
			AddPoint(new DateTime(2014, 09, 01), 61.88, 13.92);
			AddPoint(new DateTime(2014, 09, 02), 61.82, 13.92);
			AddPoint(new DateTime(2014, 09, 03), 62.90, 14.17);
			AddPoint(new DateTime(2014, 09, 04), 64.14, 14.34);
			AddPoint(new DateTime(2014, 09, 05), 65.17, 14.40);

			Points = new ReadOnlyObservableCollection<PriceCluster>(_Points);
		} // constructor

		// only to be called from the dispatcher thread!
		public void AddPoint(DateTime xDate, double xPriceVW, double xPriceDaimler) {
			_Points.Add(new PriceCluster(xDate, xPriceVW, xPriceDaimler));
		} //

	} // class
} // namespace
using System;
using System.Windows;
using System.Windows.Controls.DataVisualization.Charting;

namespace Demo {

    public class AxisPointLinear : AxisPoint {
        public readonly LinearAxis Axis;
        public readonly double Min;
        public readonly double Max;  // larger than Min;
        public readonly double Range;
        public readonly double MouseAxisValueAbsolute;

        public AxisPointLinear(Chart xChart, LinearAxis xAxis, Point xPoint, double xMin, double xMax)
            : base(xChart, xAxis, xPoint) {
            Min = xMin;
            Max = xMax;
            Range = xMax - xMin;
            Axis = xAxis;
            MouseAxisValueAbsolute = xMin + (MouseAxisValueRelative * Range);
        } // constructor

        public override string ToString() {
            string s = "Mouse: ";
            s += MouseAxisValueRelative.ToString("0.000%");
            s += "  =>  ";
            s += MouseAxisValueAbsolute.ToString("#,##0.000");
            s += " EUR for ";
            s += Axis.Orientation;
            s += "-Axis ";
            s += Axis.Title;
            return s;
        } //

    } // class

    public class AxisPointDateTime : AxisPoint {
        public readonly DateTimeAxis Axis;
        public readonly DateTime Min;
        public readonly DateTime Max;  // larger than Min;
        public readonly TimeSpan Range;
        public readonly DateTime MouseAxisValueAbsolute;

        public AxisPointDateTime(Chart xChart, DateTimeAxis xAxis, Point xPoint, DateTime xMin, DateTime xMax)
            : base(xChart, xAxis, xPoint) {
            Min = xMin;
            Max = xMax;
            Range = xMax - xMin;
            Axis = xAxis;
            MouseAxisValueAbsolute = xMin.AddMinutes(MouseAxisValueRelative * Range.TotalMinutes);
        } // constructor

        public override string ToString() {
            string s = "Mouse: ";
            s += MouseAxisValueRelative.ToString("0.000%");
            s += "  =>  ";
            s += MouseAxisValueAbsolute.ToString("dd MMM yyyy");
            s += " for ";
            s += Axis.Orientation;
            s += "-Axis ";
            s += Axis.Title;
            return s;
        } //

    } // class

    public class AxisPointFactory {
        public static AxisPoint getAxisPoint(Chart xChart, RangeAxis xAxis, Point xPoint) {
            if (xAxis is LinearAxis) {
                // some redundant basic checks
                LinearAxis lAxis = xAxis as LinearAxis;
                double? lMin;
                double? lMax;
                lMin = lAxis.ActualMinimum;
                lMax = lAxis.ActualMaximum;

                if ((!lMin.HasValue) || (!lMax.HasValue)) return null;
                if (lMin.Value >= lMax.Value) return null;

                return new AxisPointLinear(xChart, lAxis, xPoint, lMin.Value, lMax.Value);
            }
            if (xAxis is DateTimeAxis) {
                // some redundant basic checks
                DateTimeAxis lAxis = xAxis as DateTimeAxis;
                DateTime? lMin;
                DateTime? lMax;
                lMin = lAxis.ActualMinimum;
                lMax = lAxis.ActualMaximum;

                if ((!lMin.HasValue) || (!lMax.HasValue)) return null;
                if (lMin.Value >= lMax.Value) return null;

                return new AxisPointDateTime(xChart, lAxis, xPoint, lMin.Value, lMax.Value);
            }

            throw new Exception("Axis type not supported yet.");
        } //
    } // class

    public abstract class AxisPoint {
        public readonly Chart Chart;
        public readonly Point MouseAbsoluteLocation;
        public readonly double MouseAxisValueRelative;  // a number between 0% and 100%
        public readonly double Length;  // object pixel display units, larger than zero

        public AxisPoint(Chart xChart, RangeAxis xAxis, Point xPoint) {
            if (xAxis.Orientation == AxisOrientation.X) Length = xAxis.ActualWidth;
            else Length = xAxis.ActualHeight;

            if (Length <= 0) throw new Exception("Chart object length is zero or less.");

            MouseAbsoluteLocation = xChart.TranslatePoint(xPoint, xAxis);
            if (xAxis.Orientation == AxisOrientation.X) MouseAxisValueRelative = MouseAbsoluteLocation.X / Length;
            else MouseAxisValueRelative = 1.0 - (MouseAbsoluteLocation.Y / Length);

            if (MouseAxisValueRelative > 1.0) MouseAxisValueRelative = 1.0;
            else if (MouseAxisValueRelative < 0.0) MouseAxisValueRelative = 0.0;
        } // constructor

    } // class
} // namespace
WPF Charts (Part 2)
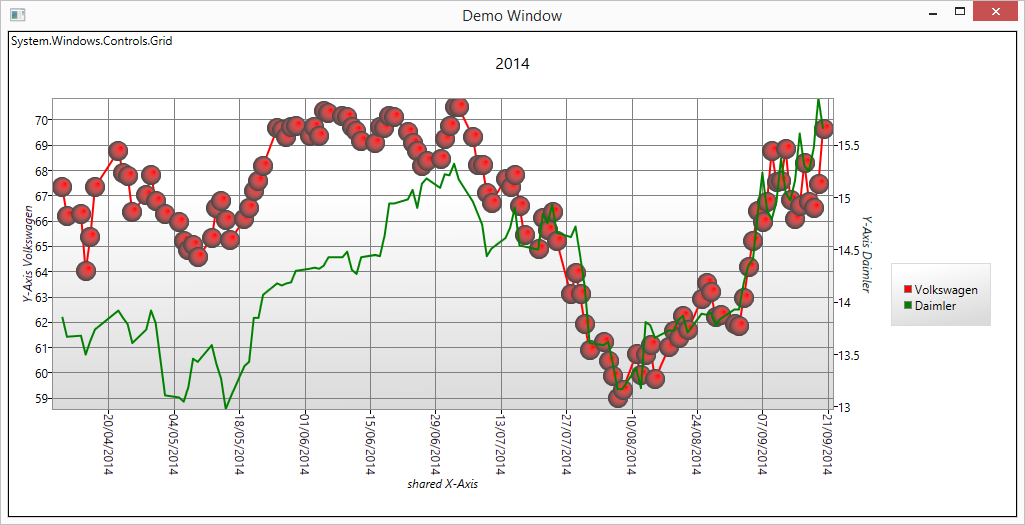
I have been quite busy in the last weeks, I will resume blogging on a regular basis again.
Today, we are enhancing the previous chart Part1 with some new features:
- One curve has circles around all points. These become transparent when you hover over them.
I chose a pretty large size to make them more obvious. - The shared X-Axis text labels are rotated by 90 degrees. Feel free to test other angles like 45 degrees.
- A three second interval timer appends new points to the chart.
- A text field shows the object types while the mouse hovers over the chart elements. This is the entry point to examine chart objects, find positions and generate on the fly ToolTips.
Some code was commented out. Play with these code pieces. You can change the following behavior:
- Hide the legend by setting its width to zero.
- Add a non-shard Axis.
- Change the color to blue rather transparent when hovering over a point.
- Besides the above, play with the code as much as you like – especially the XAML part.
In this example I used the .NET ReadOnlyObservableCollection. This collection is a wrapper around the well known ObservableCollection. The readonly collection cannot be changed (if there was any chart element to eg. cut a point out). But you can access the wrapped read/write ObservableCollection. This is a nice approach. For the outer world you have an encapsulated object. From behind the curtain you still have full access. The chart automatically updates when a new point is added to the read/write ObservableCollection.
Once again the code is pretty much self explanatory. So I am not adding a long post text.
<Window x:Class="Demo.MainWindow"
    xmlns="http://schemas.microsoft.com/winfx/2006/xaml/presentation"
    xmlns:x="http://schemas.microsoft.com/winfx/2006/xaml"
    xmlns:local="clr-namespace:Demo"
    xmlns:datavisualization="clr-namespace:System.Windows.Controls.DataVisualization;assembly=System.Windows.Controls.DataVisualization.Toolkit"
    xmlns:chart="clr-namespace:System.Windows.Controls.DataVisualization.Charting;assembly=System.Windows.Controls.DataVisualization.Toolkit"
    Title="Demo Window"
    Loaded ="Window_Loaded">

    <Grid>
        <TextBox Name="InfoBox" Text="" Height="Auto"/>
        <chart:Chart Name="myChart" Title="2014" Width="Auto" Height="Auto" MinWidth="400" MinHeight="300" MouseMove="OnMouseMove">
            <!-- hide the legend -->
            <!--<chart:Chart.LegendStyle>
                <Style TargetType="datavisualization:Legend">
                    <Setter Property="Width" Value="0" />
                </Style>
            </chart:Chart.LegendStyle>-->

            <chart:LineSeries Title="Volkswagen"
                              ItemsSource="{Binding Points}"
                              IndependentValueBinding="{Binding Date}"
                              DependentValueBinding="{Binding PriceVW}"
                              MouseMove="OnMouseMove">
                <chart:LineSeries.DependentRangeAxis>
                    <chart:LinearAxis Orientation="Y" Title="Y-Axis Volkswagen" ShowGridLines="True" />
                </chart:LineSeries.DependentRangeAxis>

                <chart:LineSeries.DataPointStyle>
                    <Style TargetType="{x:Type chart:LineDataPoint}">
                        <Setter Property="Background" Value="Red" />
                        <Setter Property="Width" Value="20" />
                        <Setter Property="Height" Value="20" />

                        <Style.Triggers>
                            <Trigger Property="IsMouseOver" Value="True">
                                <!--<Setter Property="Background" Value="Blue"/>-->
                                <Setter Property="Background" Value="Transparent" />
                            </Trigger>
                        </Style.Triggers>
                    </Style>
                </chart:LineSeries.DataPointStyle>
            </chart:LineSeries>

            <chart:LineSeries Title="Daimler"
                              ItemsSource="{Binding Points}"
                              IndependentValueBinding="{Binding Date}"
                              DependentValueBinding="{Binding PriceDaimler}">
                <chart:LineSeries.DependentRangeAxis>
                    <chart:LinearAxis Orientation="Y" Title="Y-Axis Daimler" />
                </chart:LineSeries.DependentRangeAxis>
                <!--<chart:LineSeries.IndependentAxis >
                    <chart:DateTimeAxis Orientation="X" Title="non-shared axis" />
                </chart:LineSeries.IndependentAxis>-->
                <chart:LineSeries.DataPointStyle>
                    <Style TargetType="{x:Type chart:LineDataPoint}">
                        <Setter Property="Background" Value="Green"/>
                        <Setter Property="Height" Value="0"/>
                        <Setter Property="Width" Value="0"/>
                    </Style>
                </chart:LineSeries.DataPointStyle>
            </chart:LineSeries>

            <chart:Chart.Axes>
                <chart:DateTimeAxis Name="SharedXAxis"
                                   Orientation="X"
                                  Title="shared X-Axis"
                                  ShowGridLines="True">

                    <!--rotate the X-Axis labels -->
                    <chart:DateTimeAxis.AxisLabelStyle>
                        <Style TargetType="chart:DateTimeAxisLabel">
                            <Setter Property="Template">
                                <Setter.Value>
                                    <ControlTemplate TargetType="chart:DateTimeAxisLabel">
                                        <TextBlock Text="{TemplateBinding FormattedContent}">
                                            <TextBlock.LayoutTransform>
                                                <RotateTransform Angle="90" CenterX = "40" CenterY = "30"/>
                                            </TextBlock.LayoutTransform>
                                        </TextBlock>
                                    </ControlTemplate>
                                </Setter.Value>
                            </Setter>
                        </Style>
                    </chart:DateTimeAxis.AxisLabelStyle>

                </chart:DateTimeAxis>
            </chart:Chart.Axes>
        </chart:Chart>

    </Grid>
</Window>
using System.Windows;
using System.Windows.Controls.DataVisualization.Charting;
using System.Windows.Input;

namespace Demo {
	public partial class MainWindow : Window {

		private Model _Model;

		public MainWindow() {
			InitializeComponent();
		} // constructor

		private void Window_Loaded(object sender, RoutedEventArgs e) {
			ViewModel lViewModel = new ViewModel(myChart);
			DataContext = lViewModel;
			_Model = new Model(lViewModel);
		} //

		private void OnMouseMove(object sender, MouseEventArgs e) {

			IInputElement lInputElement = sender as IInputElement; // == Chart, LineSeries ...
			Chart lChart = sender as Chart;
			LineSeries lLineSeries = sender as LineSeries;

			Point lPoint = e.GetPosition(lInputElement);
			if (lChart != null) {
				IInputElement lSelection = lChart.InputHitTest(lPoint);
				if (lSelection == null) return;
				InfoBox.Text = lSelection.GetType().ToString();
			}
			else if (lLineSeries != null) {
				IInputElement lSelection = lLineSeries.InputHitTest(lPoint);
				if (lSelection == null) return;
				InfoBox.Text = lSelection.GetType().ToString();
			}
		} //

	} // class
} // namespace
using System;
using System.Linq;
using System.Windows.Threading;

namespace Demo {
	public class Model {
		private ViewModel _ViewModel;

		public Model(ViewModel xViewModel) {
			_ViewModel = xViewModel;
			DispatcherTimer lTimer = new DispatcherTimer();
			lTimer.Interval = new TimeSpan(0, 0, 3);
			lTimer.Tick += new EventHandler(Timer_Tick);
			lTimer.Start();
		} // constructor

		void Timer_Tick(object sender, EventArgs e) {
			Random r = new Random();
			PriceCluster lPriceCluster = _ViewModel.Points.Last();
			double lVW = lPriceCluster.PriceVW * (1 + ((2.0 * (r.NextDouble() - 0.5)) / 30.0));
			double lDaimler = lPriceCluster.PriceDaimler * (1 + ((2.0 * (r.NextDouble() - 0.5)) / 30.0));
			_ViewModel.AddPoint(lPriceCluster.Date.AddDays(1), lVW, lDaimler);
		} //

	} // class
} // namespace
using System;
using System.Collections.ObjectModel;
using System.Windows.Controls.DataVisualization.Charting;

namespace Demo {
	public class ViewModel {
		private readonly Chart _Chart;
		public ReadOnlyObservableCollection<PriceCluster> Points { get; private set; }
		private ObservableCollection<PriceCluster> _Points = new ObservableCollection<PriceCluster>();

		public ViewModel(Chart xChart) {
			_Chart = xChart;

			AddPoint(new DateTime(2014, 04, 10), 67.29, 13.85);
			AddPoint(new DateTime(2014, 04, 11), 66.15, 13.66);
			AddPoint(new DateTime(2014, 04, 14), 66.22, 13.67);
			AddPoint(new DateTime(2014, 04, 15), 63.99, 13.49);
			AddPoint(new DateTime(2014, 04, 16), 65.32, 13.62);
			AddPoint(new DateTime(2014, 04, 17), 67.29, 13.73);
			AddPoint(new DateTime(2014, 04, 22), 68.72, 13.91);
			AddPoint(new DateTime(2014, 04, 23), 67.85, 13.84);
			AddPoint(new DateTime(2014, 04, 24), 67.75, 13.78);
			AddPoint(new DateTime(2014, 04, 25), 66.29, 13.60);
			AddPoint(new DateTime(2014, 04, 28), 66.99, 13.73);
			AddPoint(new DateTime(2014, 04, 29), 67.79, 13.91);
			AddPoint(new DateTime(2014, 04, 30), 66.73, 13.79);
			AddPoint(new DateTime(2014, 05, 02), 66.24, 13.10);
			AddPoint(new DateTime(2014, 05, 05), 65.90, 13.08);
			AddPoint(new DateTime(2014, 05, 06), 65.16, 13.04);
			AddPoint(new DateTime(2014, 05, 07), 64.80, 13.18);
			AddPoint(new DateTime(2014, 05, 08), 65.00, 13.45);
			AddPoint(new DateTime(2014, 05, 09), 64.52, 13.42);
			AddPoint(new DateTime(2014, 05, 12), 65.28, 13.58);
			AddPoint(new DateTime(2014, 05, 13), 66.48, 13.40);
			AddPoint(new DateTime(2014, 05, 14), 66.74, 13.26);
			AddPoint(new DateTime(2014, 05, 15), 66.00, 12.97);
			AddPoint(new DateTime(2014, 05, 16), 65.21, 13.08);
			AddPoint(new DateTime(2014, 05, 19), 66.02, 13.38);
			AddPoint(new DateTime(2014, 05, 20), 66.46, 13.42);
			AddPoint(new DateTime(2014, 05, 21), 67.15, 13.84);
			AddPoint(new DateTime(2014, 05, 22), 67.52, 13.84);
			AddPoint(new DateTime(2014, 05, 23), 68.14, 14.06);
			AddPoint(new DateTime(2014, 05, 26), 69.61, 14.17);
			AddPoint(new DateTime(2014, 05, 27), 69.56, 14.15);
			AddPoint(new DateTime(2014, 05, 28), 69.29, 14.17);
			AddPoint(new DateTime(2014, 05, 29), 69.65, 14.18);
			AddPoint(new DateTime(2014, 05, 30), 69.70, 14.29);
			AddPoint(new DateTime(2014, 06, 02), 69.32, 14.31);
			AddPoint(new DateTime(2014, 06, 03), 69.68, 14.32);
			AddPoint(new DateTime(2014, 06, 04), 69.31, 14.31);
			AddPoint(new DateTime(2014, 06, 05), 70.31, 14.34);
			AddPoint(new DateTime(2014, 06, 06), 70.24, 14.42);
			AddPoint(new DateTime(2014, 06, 09), 70.09, 14.42);
			AddPoint(new DateTime(2014, 06, 10), 70.08, 14.47);
			AddPoint(new DateTime(2014, 06, 11), 69.66, 14.30);
			AddPoint(new DateTime(2014, 06, 12), 69.49, 14.26);
			AddPoint(new DateTime(2014, 06, 13), 69.12, 14.42);
			AddPoint(new DateTime(2014, 06, 16), 69.05, 14.44);
			AddPoint(new DateTime(2014, 06, 17), 69.65, 14.43);
			AddPoint(new DateTime(2014, 06, 18), 69.62, 14.62);
			AddPoint(new DateTime(2014, 06, 19), 70.10, 14.93);
			AddPoint(new DateTime(2014, 06, 20), 70.08, 14.93);
			AddPoint(new DateTime(2014, 06, 23), 69.46, 14.97);
			AddPoint(new DateTime(2014, 06, 24), 69.04, 15.06);
			AddPoint(new DateTime(2014, 06, 25), 68.71, 14.89);
			AddPoint(new DateTime(2014, 06, 26), 68.14, 15.12);
			AddPoint(new DateTime(2014, 06, 27), 68.33, 15.17);
			AddPoint(new DateTime(2014, 06, 30), 68.40, 15.08);
			AddPoint(new DateTime(2014, 07, 01), 69.19, 15.21);
			AddPoint(new DateTime(2014, 07, 02), 69.72, 15.20);
			AddPoint(new DateTime(2014, 07, 03), 70.44, 15.31);
			AddPoint(new DateTime(2014, 07, 04), 70.44, 15.16);
			AddPoint(new DateTime(2014, 07, 07), 69.28, 14.95);
			AddPoint(new DateTime(2014, 07, 08), 68.15, 14.84);
			AddPoint(new DateTime(2014, 07, 09), 68.16, 14.73);
			AddPoint(new DateTime(2014, 07, 10), 67.05, 14.43);
			AddPoint(new DateTime(2014, 07, 11), 66.68, 14.50);
			AddPoint(new DateTime(2014, 07, 14), 67.61, 14.60);
			AddPoint(new DateTime(2014, 07, 15), 67.28, 14.70);
			AddPoint(new DateTime(2014, 07, 16), 67.77, 14.89);
			AddPoint(new DateTime(2014, 07, 17), 66.56, 14.53);
			AddPoint(new DateTime(2014, 07, 18), 65.40, 14.52);
			AddPoint(new DateTime(2014, 07, 21), 64.84, 14.49);
			AddPoint(new DateTime(2014, 07, 22), 66.09, 14.83);
			AddPoint(new DateTime(2014, 07, 23), 65.58, 14.74);
			AddPoint(new DateTime(2014, 07, 24), 66.30, 14.92);
			AddPoint(new DateTime(2014, 07, 25), 65.15, 14.65);
			AddPoint(new DateTime(2014, 07, 28), 63.08, 14.61);
			AddPoint(new DateTime(2014, 07, 29), 63.89, 14.71);
			AddPoint(new DateTime(2014, 07, 30), 63.07, 14.43);
			AddPoint(new DateTime(2014, 07, 31), 61.88, 14.13);
			AddPoint(new DateTime(2014, 08, 01), 60.85, 13.60);
			AddPoint(new DateTime(2014, 08, 04), 61.17, 13.58);
			AddPoint(new DateTime(2014, 08, 05), 60.43, 13.61);
			AddPoint(new DateTime(2014, 08, 06), 59.82, 13.40);
			AddPoint(new DateTime(2014, 08, 07), 58.95, 13.16);
			AddPoint(new DateTime(2014, 08, 08), 59.27, 13.16);
			AddPoint(new DateTime(2014, 08, 11), 60.71, 13.36);
			AddPoint(new DateTime(2014, 08, 12), 59.85, 13.17);
			AddPoint(new DateTime(2014, 08, 13), 60.66, 13.80);
			AddPoint(new DateTime(2014, 08, 14), 61.07, 13.77);
			AddPoint(new DateTime(2014, 08, 15), 59.71, 13.65);
			AddPoint(new DateTime(2014, 08, 18), 60.99, 13.72);
			AddPoint(new DateTime(2014, 08, 19), 61.60, 13.72);
			AddPoint(new DateTime(2014, 08, 20), 61.33, 13.82);
			AddPoint(new DateTime(2014, 08, 21), 62.20, 13.86);
			AddPoint(new DateTime(2014, 08, 22), 61.65, 13.70);
			AddPoint(new DateTime(2014, 08, 25), 62.88, 13.88);
			AddPoint(new DateTime(2014, 08, 26), 63.49, 13.87);
			AddPoint(new DateTime(2014, 08, 27), 63.15, 13.89);
			AddPoint(new DateTime(2014, 08, 28), 62.16, 13.77);
			AddPoint(new DateTime(2014, 08, 29), 62.24, 13.83);
			AddPoint(new DateTime(2014, 09, 01), 61.88, 13.92);
			AddPoint(new DateTime(2014, 09, 02), 61.82, 13.92);
			AddPoint(new DateTime(2014, 09, 03), 62.90, 14.17);
			AddPoint(new DateTime(2014, 09, 04), 64.14, 14.34);
			AddPoint(new DateTime(2014, 09, 05), 65.17, 14.40);

			Points = new ReadOnlyObservableCollection<PriceCluster>(_Points);
		} // constructor

		// only to be called from the dispatcher thread!
		public void AddPoint(DateTime xDate, double xPriceVW, double xPriceDaimler) {
			_Points.Add(new PriceCluster(xDate, xPriceVW, xPriceDaimler));
		} //

	} // class
} // namespace
using System;

namespace Demo {
	public class PriceCluster {
		public DateTime Date { get; set; }
		public double PriceVW { get; set; }
		public double PriceDaimler { get; set; }

		public PriceCluster(DateTime xDate, double xPriceVW, double xPriceDaimler) {
			Date = xDate;
			PriceVW = xPriceVW;
			PriceDaimler = xPriceDaimler;
		} // constructor
	} // class
} // namespace
WPF Charts (Part 1)
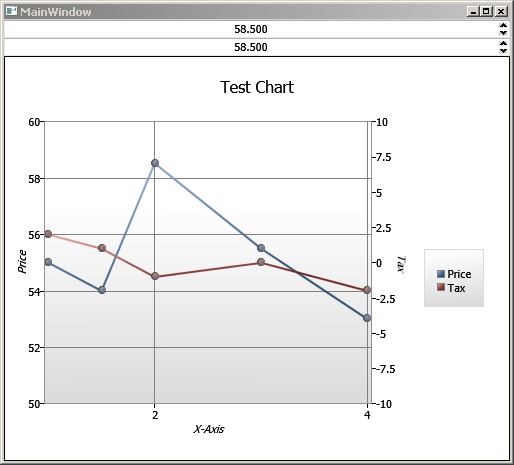
I was playing around with techniques and built a short chart demo. There are many tools out there to create charts. I prefer the good old WPF Toolkit solution on codeplex, which adds the namespace ‘System.Windows.Controls.DataVisualization.Chart’ and is supported by Microsoft. You can expect high compatibility at zero costs.
Do not confuse this one with the Extended WPF Toolkit, which is free software, but also offers a commercial solution.
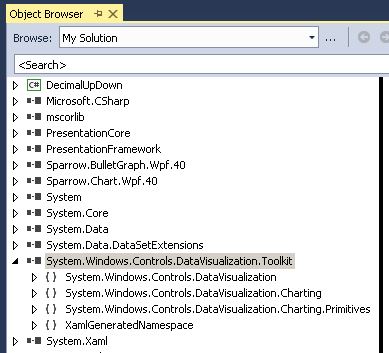
We are going to create various WPF charts in the coming weeks. The programming pattern series will continue at some point afterwards. What topics I choose is always closely related to my personal interests at that time. I find it hard to motivate myself otherwise.
This is a very simple example today. I added two NumericUpDown controls to add some flavor. Well, in the WPF Toolkit they are not called NumericUpDown anymore. There are corresponding DoubleUpDown/ DecimalUpDown/IntegerUpDown controls.
The lower DoubleUpDown control in this demo is linked to the upper one. And in turn the upper one is bound to a DataContext object property. This demonstrates a chain of bindings. Hence three objects are linked together holding the same value.
You can uncomment the prepared block in the XAML code. This will influence the line color and the line thickness. This template has its limits. It does not change the color of related objects. Anyway, it is a good start.
The chart has two curves. You can influence one by using any of the two DoubleUpDown controls.
The used ObservableCollection to store the curve points could be a post on its own. Basically, it is a WPF collection, which notifies WPF when you add or remove items from/to the list. But how do you update a chart, which only changes a value of a single point? The four methods to invalidate the drawing area are somewhat not showing the expected results.
You can set the DataContext to null and then set it back to your source. This is not the fastest way. But practically speaking, changing one value does not happen very often and setting the DataContext is quick and easy. Usually you only add or remove points. If you are looking for animations, they are dealt with differently in WPF. You should have a look into System.Windows.Media.Storyboard for that. In this example I chose to simply remove and add the affected point.
You don’t have to re-insert the point at the right collection position. I just did it to easily find the same point again. A simple Chart.Add() would work as well.
WPF will most likely not show the point removal on the screen. Tell me if I am wrong. I haven’t seen any impact. I guess the Dispatcher thread is blocked while you are using it on the WPF event call. A signal, which may happen right after the event finishes, will trigger the queued removal and addition in one go.
<Window x:Class="Demo.MainWindow"
        xmlns="http://schemas.microsoft.com/winfx/2006/xaml/presentation"
        xmlns:x="http://schemas.microsoft.com/winfx/2006/xaml"
        xmlns:tool="clr-namespace:Xceed.Wpf.Toolkit;assembly=Xceed.Wpf.Toolkit"
        xmlns:dv="clr-namespace:System.Windows.Controls.DataVisualization.Charting;assembly=System.Windows.Controls.DataVisualization.Toolkit"
        xmlns:local="clr-namespace:Demo"
        Title="MainWindow" Height="350" Width="525"
        Initialized="Window_Initialized">
    <Grid>
        <DockPanel LastChildFill="True">
            <tool:DoubleUpDown DockPanel.Dock="Top" Name="UpDown1" AllowSpin="True"
                               Minimum="0" Maximum="100.5" Increment="0.5" ClipValueToMinMax="True"
                               DefaultValue="0" Watermark="enter a value"
                               MouseWheelActiveOnFocus="True" MouseWheelActiveTrigger="FocusedMouseOver"
                               FormatString="N3" ShowButtonSpinner="True" TextAlignment="Center"
                               Value="{Binding PriceOfDay3, Mode=OneWayToSource, FallbackValue=55.5 }" />

            <tool:DoubleUpDown DockPanel.Dock="Top" Name="UpDown2" AllowSpin="True"
                               Minimum="0" Maximum="100.5" Increment="0.5" ClipValueToMinMax="True"
                               Value="{Binding Value, ElementName=UpDown1, Mode=TwoWay}"
                               MouseWheelActiveOnFocus="True" MouseWheelActiveTrigger="FocusedMouseOver"
                               FormatString="N3" ShowButtonSpinner="True" TextAlignment="Center"/>


            <dv:Chart Name="Chart1" Title="Test Chart" >

                <dv:LineSeries Title="Price"
                            ItemsSource="{Binding Points, Delay=2500, IsAsync=False}"
                            IndependentValueBinding="{Binding Day}"
                            DependentValueBinding="{Binding Price}" >
                    <dv:LineSeries.DependentRangeAxis>
                        <dv:LinearAxis Orientation="Y" Title="Price"
                                    Minimum="50" Maximum="60" Interval="2"
                                    ShowGridLines="True"/>
                    </dv:LineSeries.DependentRangeAxis>
                    <!--<dv:LineSeries.Template>
                        --><!-- change the line color to green and set the thickness --><!--
                        <ControlTemplate TargetType="dv:LineSeries">
                            <Canvas x:Name="PlotArea">
                                <Polyline x:Name="polyline"
                                          Points="{TemplateBinding Points}"
                                          Style="{TemplateBinding PolylineStyle}"
                                          Stroke="Green" StrokeThickness="4" />
                            </Canvas>
                        </ControlTemplate>
                    </dv:LineSeries.Template>-->
                </dv:LineSeries>

                <dv:LineSeries Title="Tax"
                            ItemsSource="{Binding Points, Delay=2500, IsAsync=False}"
                            IndependentValueBinding="{Binding Day}"
                            DependentValueBinding="{Binding Tax}">

                    <dv:LineSeries.DependentRangeAxis>
                        <dv:LinearAxis Orientation="Y" Title="Tax" Minimum="-10" Maximum="10" Interval="2.5"/>
                    </dv:LineSeries.DependentRangeAxis>
                </dv:LineSeries>
                <dv:Chart.Axes>
                    <dv:LinearAxis Orientation="X" Title="X-Axis" Interval="2" ShowGridLines="True"/>
                </dv:Chart.Axes>
            </dv:Chart>
        </DockPanel>
    </Grid>
</Window>
using System;
using System.Collections.ObjectModel;
using System.Windows;
using System.Windows.Controls.DataVisualization.Charting;

namespace Demo {

  public partial class MainWindow : Window {
    public MainWindow() { InitializeComponent(); }

    public class DataPoint {
      public double Day { get; set; }
      public double Price { get; set; }
      public double Tax { get; set; }
    } // class

    public class ViewModel {
      private readonly Chart _Chart;
      public ObservableCollection<DataPoint> Points { get; private set; }

      public double PriceOfDay3 {
        get { lock (this) return Points[2].Price; }
        set {
          lock (this) {
            DataPoint p = Points[2];
            p.Price = value;
            Points.Remove(p);
            Points.Insert(2, p);  // same position
            //Points.Add(p); // append to the end
          }
        }
      } //

      public ViewModel(Chart xChart) {
        _Chart = xChart;
        Points = new ObservableCollection<DataPoint>();

        Points.Add(new DataPoint() { Day = 1.0, Price = 55, Tax = 2.0 });
        Points.Add(new DataPoint() { Day = 1.5, Price = 54, Tax = 1.0 });
        Points.Add(new DataPoint() { Day = 2.0, Price = 58, Tax = -1.0 });
        Points.Add(new DataPoint() { Day = 3.0, Price = 55.5, Tax = 0.0 });
        Points.Add(new DataPoint() { Day = 4.0, Price = 53, Tax = -2.0 });
      } // constructor

    } // class

    private void Window_Initialized(object sender, EventArgs e) {
      ViewModel lViewModel = new ViewModel(Chart1);
      DataContext = lViewModel;
    } //


  } // class
} // namespace
Singleton Pattern

I did never really care about programming patterns. I had to come up with ideas when I needed them. And back in the Commodore 64 ages, when I wrote my first “Hello World” program in Basic, there was no book about patterns anyway.
When you only allow one object instance, that is called Singleton.
Have you ever come across Remoting? You send a request to a server. There is a choice between Singleton and SingleCall. It basically means that you:
- Always use the same object or
- create a new object for each request.
Let’s say you order 4 pints of beer using your tablet PC rather than calling the sexy, blond, and 18-year-old waitress. You obviously want 4 pints at once. Therefore the correct choice would be SingleCall; 4 distinct objects. The geeky waitress reacts. She responds via her high-tech cash register: “Who are you?”. She could ask that 10 times and unless you get upset, you would always give the same answer. Any good programmer realizes that this would only require one object instance – a Singleton.
There are several ways to do this. The conceptual idea is pretty easy. (Wikipedia has some more details.) In this post I am only giving you my favourite pattern, which should always work. You don’t need more unless you want to show off with some cheap stuff.
Example:
Remove the sealed keyword in case you need to make the class inheritable.
Notice the double-check if (_Instance == null) ...
The reason is:
- The first check avoids entering the lock in 99.9999% of the calls. You save precious processor time.
- The second check avoids an unlikely multithreading problem. A thread A could enter the lock and not finish before a thread B arrives. B has to wait in front of the lock. A exits the lock, now B enters the lock. Without the second check, B would now create a new instance. And this is, what we are trying to avoid.
using System;

namespace Singleton {

  public sealed class JustOne {
    private static readonly object _Lock = new object();
    private static JustOne _Instance = null;
    private JustOne() { }

    public static JustOne Instance {
      get {
        if (_Instance == null) {
          lock (_Lock) {
            if (_Instance == null) _Instance = new JustOne();
          }
        }
        return _Instance;
      }
    } //

    public new string GetHashCode() { return base.GetHashCode().ToString(); }
  } // class

  class Program {

    static void Main(string[] args) {
      JustOne A = JustOne.Instance;
      JustOne B = JustOne.Instance;
      Console.WriteLine("HashCode of object A: " + A.GetHashCode());
      Console.WriteLine("HashCode of object B: " + B.GetHashCode());

      Console.ReadLine();
    } // main

  } // class
} // namespace
Facade Pattern

Don’t shoot the messenger!
This is something that you are doing all the time. We just name it now. The Facade Pattern is a structural programming design pattern. To explain it in a nutshell:
A class contains many references to objects, which are invisible to the client. The client has a reduced command set to keep things simple.
The class receives the simple command and takes care about the real complexity behind the facade, which is presented to the client. Think of a cash dispenser. All you have to know is a few buttons. The legal structure, the buildings, the accounting, the risk etc. … all is invisible to the client, who only cares about getting cash at this very moment.
namespace FacadePattern {

  internal class Burger {
    public void Prepare() { }
    public void WarmUp() { }
    public void Wrap() { }
  } // class

  internal class Fries {
    public void Fry() { }
    public void KeepWarm() { }
  } // class

  internal class Drink {
    public enum eDrink { Coke, SevenUp, Orange, Apple, Milk, Tea, Coffee }
    public bool IsSugarFree { set; get; }
    public bool IsHot { set; get; }
    public void Fill(eDrink xDrink) { }
  } // class

  internal class Extras {
    public void AddSalt() { }
    public void AddKetchup() { }
    public void AddMayo() { }
    public void AddNapkin() { }
  } // class

  public class MealFacade {
    private Burger _Burger = new Burger();
    private Fries _Fries = new Fries();
    private Drink _Drink = new Drink();
    private Extras _Extras = new Extras();

    public void MakeClientHappy() {
      _Drink.IsHot = false;
      _Drink.IsSugarFree = true;
      _Drink.Fill(Drink.eDrink.Coke);
      _Fries.Fry();
      _Burger.Prepare();
      _Burger.Wrap();
      _Extras.AddKetchup();
      _Extras.AddSalt();
      _Extras.AddNapkin();
    } //
  } // class

  class Program {
    static void Main(string[] args) {
      MealFacade lBurgerMeal = new MealFacade();
      lBurgerMeal.MakeClientHappy();
    } // main

  } // class
} // namespace
